| Red | Green | Blue | |
| z | 17.64 | ||
| znorm | Inf | ||
| sky | -NaN | -NaN | -Inf |
| S/N | 16.4 | 30.7 | 32.5 |
| S/N(c) | 0.0 | 0.0 | 0.0 |
| SN(E/C) |
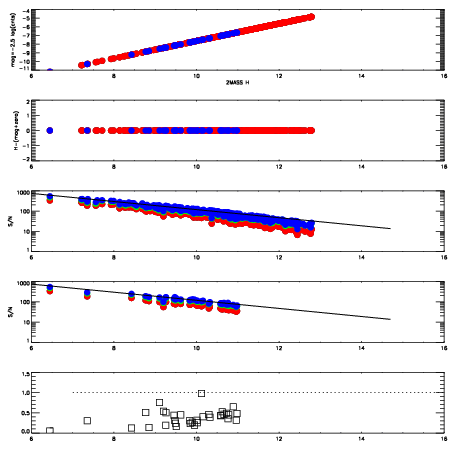
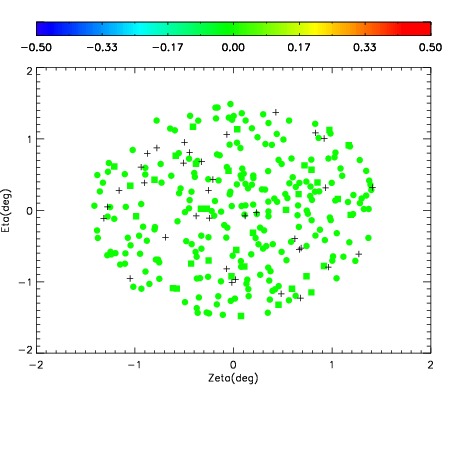

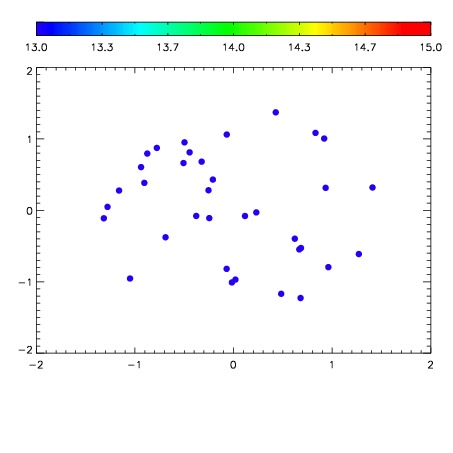

| Frame | Nreads | Zeropoints | Mag plots | Spatial mag deviation | Spatial sky 16325A emission deviations (filled: sky, open: star) | Spatial sky continuum emission | Spatial sky telluric CO2 absorption deviations (filled: H < 10) | |||||||||||||||||||||||
| 0 | 0 |
|
|
|
|
|
|
| IPAIR | NAME | SHIFT | NEWSHIFT | S/N | NAME | SHIFT | NEWSHIFT | S/N |
| 0 | 12030064 | 0.496767 | 0.00000 | 18.0606 | 12030066 | -0.00585306 | 0.502620 | 18.2266 |
| 1 | 12030060 | 0.495801 | 0.000966012 | 18.5710 | 12030059 | 0.00000 | 0.496767 | 18.7316 |
| 2 | 12030061 | 0.495069 | 0.00169802 | 18.4095 | 12030062 | -0.00508695 | 0.501854 | 18.5113 |
| 3 | 12030065 | 0.496452 | 0.000315011 | 18.0526 | 12030063 | -0.00547896 | 0.502246 | 18.1241 |