| Red | Green | Blue | |
| z | 17.64 | ||
| znorm | Inf | ||
| sky | -Inf | -Inf | -Inf |
| S/N | 16.5 | 31.7 | 33.7 |
| S/N(c) | 0.0 | 0.0 | 0.0 |
| SN(E/C) |
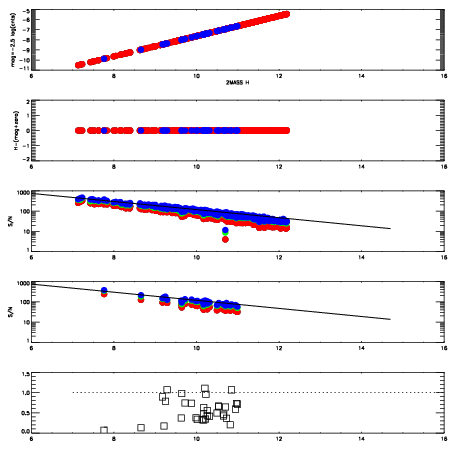
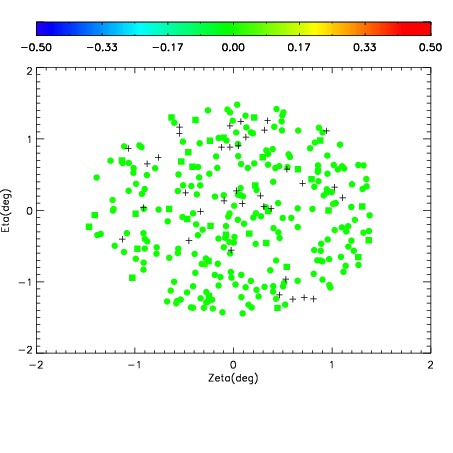
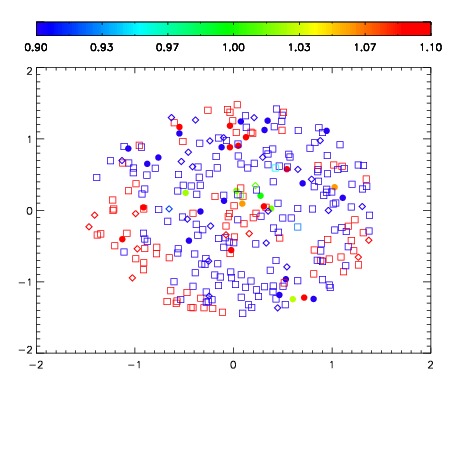


| Frame | Nreads | Zeropoints | Mag plots | Spatial mag deviation | Spatial sky 16325A emission deviations (filled: sky, open: star) | Spatial sky continuum emission | Spatial sky telluric CO2 absorption deviations (filled: H < 10) | |||||||||||||||||||||||
| 0 | 0 |
|
|
|
|
|
|
| IPAIR | NAME | SHIFT | NEWSHIFT | S/N | NAME | SHIFT | NEWSHIFT | S/N |
| 0 | 11720079 | 0.488532 | 0.00000 | 18.2353 | 11720084 | -0.00655422 | 0.495086 | 17.8833 |
| 1 | 11720078 | 0.487496 | 0.00103602 | 18.6321 | 11720077 | 0.00000 | 0.488532 | 18.5929 |
| 2 | 11720082 | 0.486268 | 0.00226399 | 18.3679 | 11720081 | -0.00349890 | 0.492031 | 18.3796 |
| 3 | 11720083 | 0.487066 | 0.00146601 | 18.2915 | 11720080 | -0.00332904 | 0.491861 | 18.2315 |