| Red | Green | Blue | |
| z | 17.64 | ||
| znorm | Inf | ||
| sky | -Inf | -Inf | -Inf |
| S/N | 29.3 | 47.2 | 51.8 |
| S/N(c) | 0.0 | 0.0 | 0.0 |
| SN(E/C) |
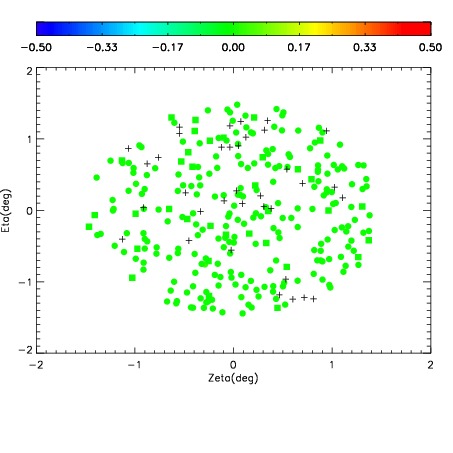
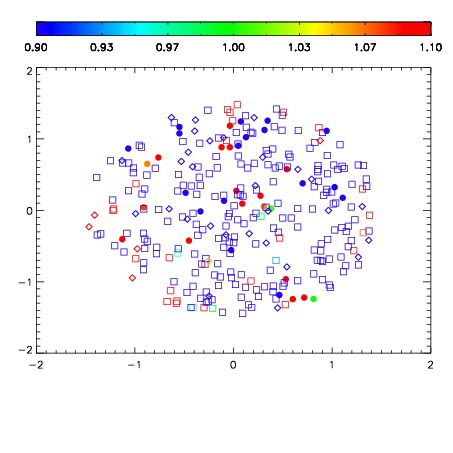
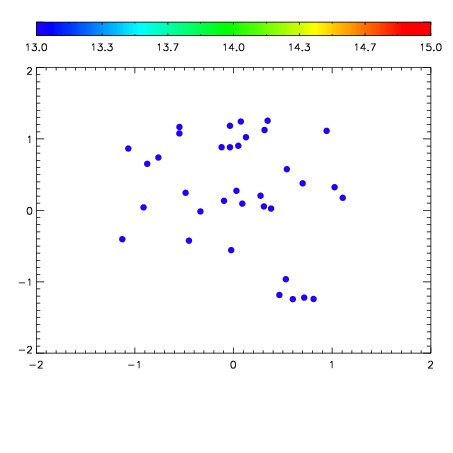

| Frame | Nreads | Zeropoints | Mag plots | Spatial mag deviation | Spatial sky 16325A emission deviations (filled: sky, open: star) | Spatial sky continuum emission | Spatial sky telluric CO2 absorption deviations (filled: H < 10) | |||||||||||||||||||||||
| 0 | 0 |
|
|
|
|
|
|
| IPAIR | NAME | SHIFT | NEWSHIFT | S/N | NAME | SHIFT | NEWSHIFT | S/N |
| 0 | 12000068 | 0.499589 | 0.00000 | 19.0870 | 12000070 | -0.000916998 | 0.500506 | 19.0930 |
| 1 | 12000071 | 0.496438 | 0.00315100 | 19.1421 | 12000069 | -0.000282941 | 0.499872 | 19.1059 |
| 2 | 12000067 | 0.499583 | 5.99027e-06 | 19.1307 | 12000073 | -0.00357229 | 0.503161 | 19.1045 |
| 3 | 12000072 | 0.497034 | 0.00255498 | 19.0745 | 12000066 | 0.00000 | 0.499589 | 19.0634 |