| Red | Green | Blue | |
| z | 17.64 | ||
| znorm | Inf | ||
| sky | -Inf | -Inf | -Inf |
| S/N | 21.3 | 36.8 | 39.0 |
| S/N(c) | 0.0 | 0.0 | 0.0 |
| SN(E/C) |
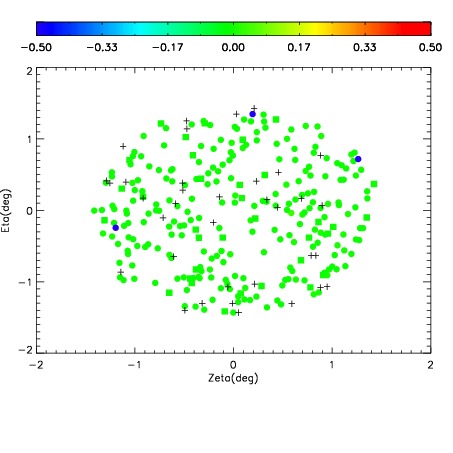
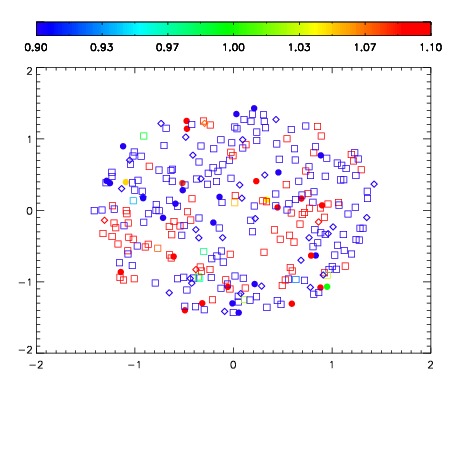
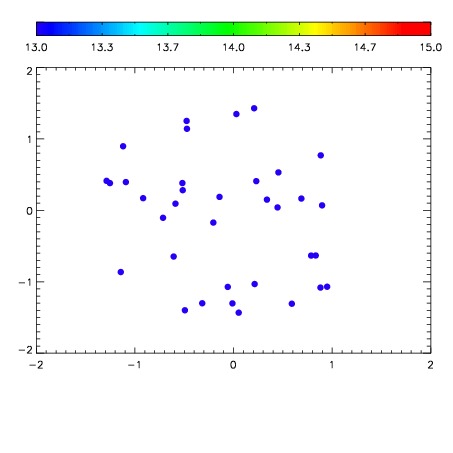

| Frame | Nreads | Zeropoints | Mag plots | Spatial mag deviation | Spatial sky 16325A emission deviations (filled: sky, open: star) | Spatial sky continuum emission | Spatial sky telluric CO2 absorption deviations (filled: H < 10) | |||||||||||||||||||||||
| 0 | 0 |
|
|
|
|
|
|
| IPAIR | NAME | SHIFT | NEWSHIFT | S/N | NAME | SHIFT | NEWSHIFT | S/N |
| 0 | 11730094 | 0.496280 | 0.00000 | 18.7231 | 11730091 | -0.00203720 | 0.498317 | 18.8107 |
| 1 | 11730093 | 0.495590 | 0.000690013 | 18.7465 | 11730088 | 0.00000 | 0.496280 | 18.8226 |
| 2 | 11730089 | 0.494771 | 0.00150901 | 18.6572 | 11730095 | -0.00266091 | 0.498941 | 18.8081 |
| 3 | 11730090 | 0.495472 | 0.000808001 | 18.6388 | 11730092 | -0.00131053 | 0.497591 | 18.7572 |