| Frame | Nreads | Zeropoints | Mag plots
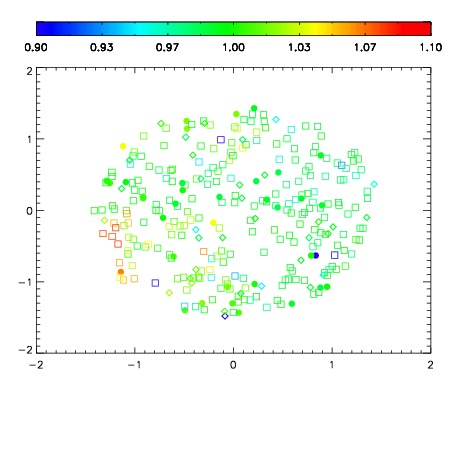
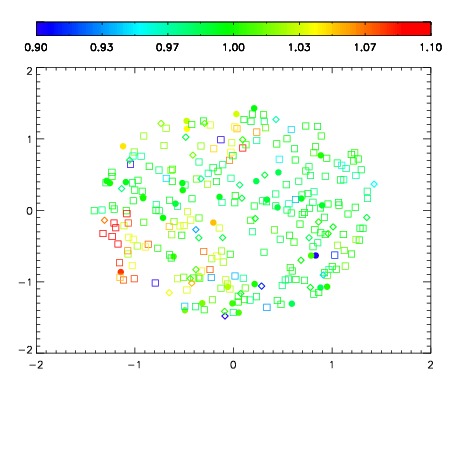
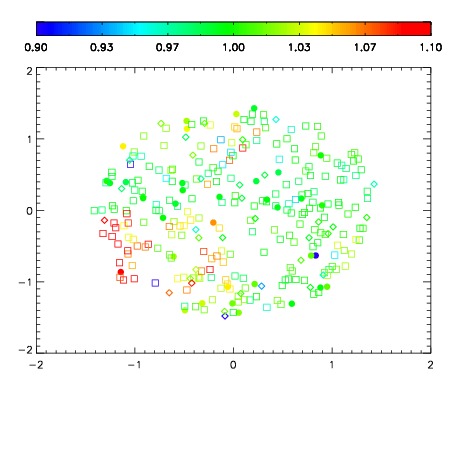
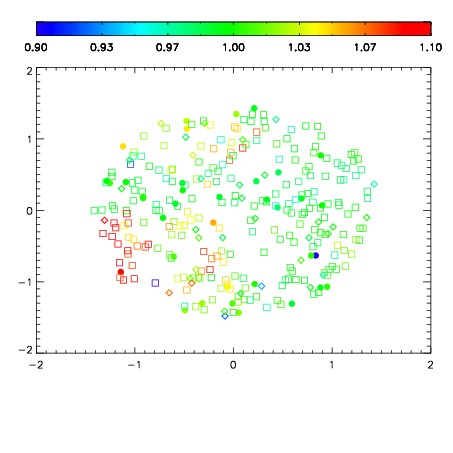
| Spatial mag deviation
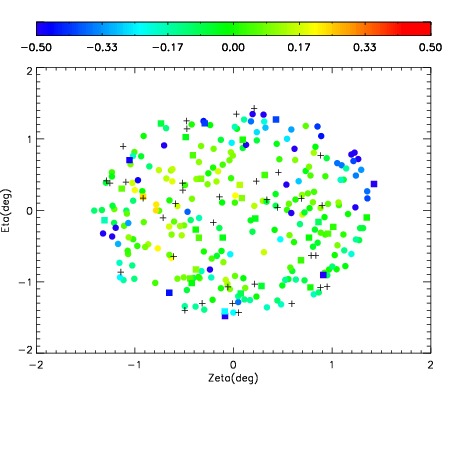
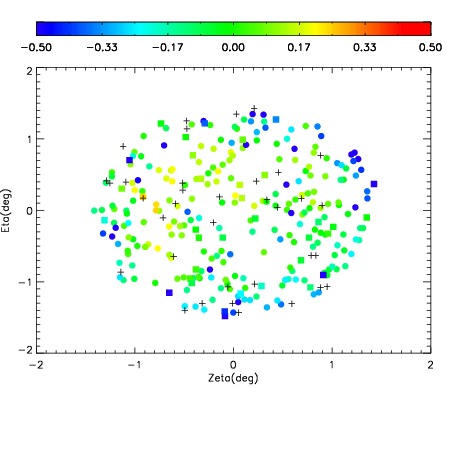
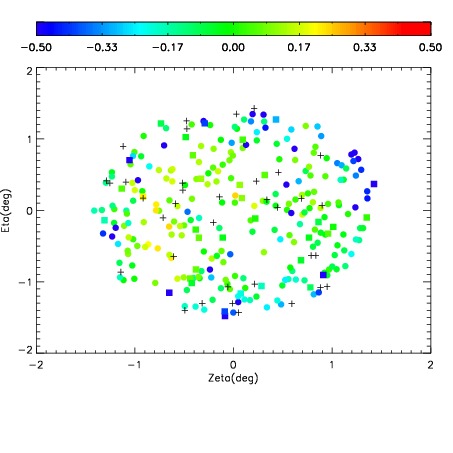
| Spatial sky 16325A emission deviations (filled: sky, open: star)
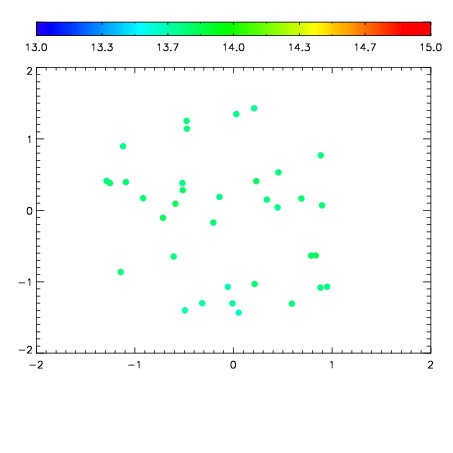
| Spatial sky continuum emission
| Spatial sky telluric CO2 absorption deviations (filled: H < 10)
|
| 12020027
| 47
| | Red | Green | Blue
| | z | | 16.96
| | znorm | | 12.78
| | sky | 13.6 | 13.5 | 13.7
| | S/N | 3.0 | 5.9 | 6.4
| | S/N(c) | 3.6 | 3.6 | 1.8
| | SN(E/C) 0.84
|
| 
| 
| 
| 
| 
|
| 12020028
| 47
| | Red | Green | Blue
| | z | | 18.00
| | znorm | | 13.82
| | sky | 14.1 | 13.9 | 14.1
| | S/N | 6.7 | 12.3 | 13.1
| | S/N(c) | 7.4 | 6.4 | 3.2
| | SN(E/C) 0.70
|
| 
| 
| 
| 
| 
|
| 12020029
| 47
| | Red | Green | Blue
| | z | | 17.73
| | znorm | | 13.55
| | sky | 13.8 | 13.9 | 14.1
| | S/N | 5.4 | 10.3 | 10.8
| | S/N(c) | 5.9 | 5.4 | 2.8
| | SN(E/C) 0.79
|
| 
| 
| 
| 
| 
|
| 12020030
| 47
| | Red | Green | Blue
| | z | | 17.38
| | znorm | | 13.20
| | sky | 13.7 | 13.7 | 14.0
| | S/N | 4.2 | 7.7 | 8.3
| | S/N(c) | 4.6 | 4.5 | 2.3
| | SN(E/C) 0.81
|
| 
| 
| 
| 
| 
|