| Red | Green | Blue | |
| z | 17.64 | ||
| znorm | Inf | ||
| sky | -NaN | -NaN | -NaN |
| S/N | 22.7 | 41.2 | 42.3 |
| S/N(c) | 0.0 | 0.0 | 0.0 |
| SN(E/C) |
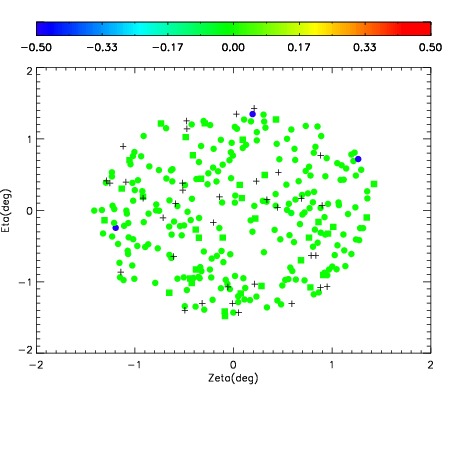
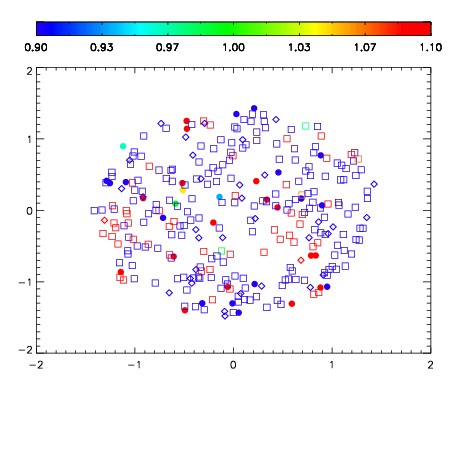
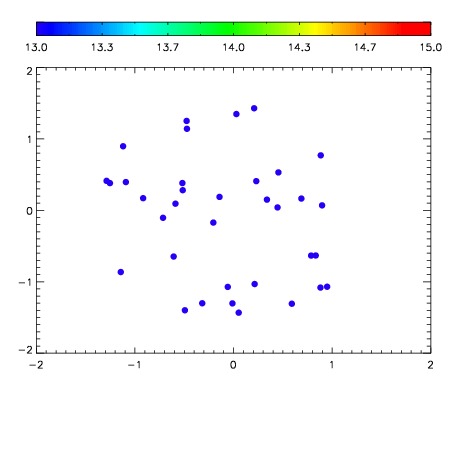

| Frame | Nreads | Zeropoints | Mag plots | Spatial mag deviation | Spatial sky 16325A emission deviations (filled: sky, open: star) | Spatial sky continuum emission | Spatial sky telluric CO2 absorption deviations (filled: H < 10) | |||||||||||||||||||||||
| 0 | 0 |
|
|
|
|
|
|
| IPAIR | NAME | SHIFT | NEWSHIFT | S/N | NAME | SHIFT | NEWSHIFT | S/N |
| 0 | 12060083 | 0.500630 | 0.00000 | 18.9993 | 12060088 | -0.00394027 | 0.504570 | 19.0389 |
| 1 | 12060086 | 0.499316 | 0.00131401 | 18.9416 | 12060085 | -0.00434880 | 0.504979 | 18.9955 |
| 2 | 12060082 | 0.499736 | 0.000894010 | 18.9193 | 12060084 | -0.00453342 | 0.505163 | 18.9838 |
| 3 | 12060087 | 0.500194 | 0.000436008 | 18.8710 | 12060081 | 0.00000 | 0.500630 | 18.9281 |