| Red | Green | Blue | |
| z | 17.64 | ||
| znorm | Inf | ||
| sky | -Inf | -Inf | -NaN |
| S/N | 13.9 | 26.0 | 27.1 |
| S/N(c) | 0.0 | 0.0 | 0.0 |
| SN(E/C) |
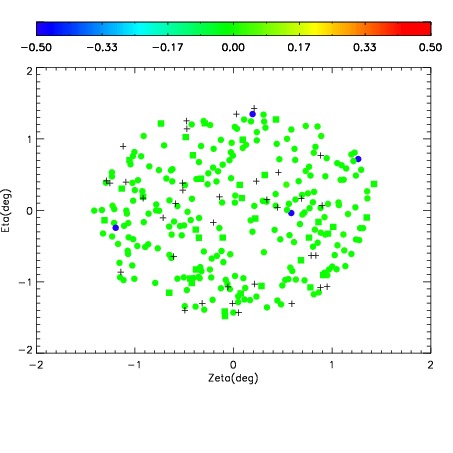
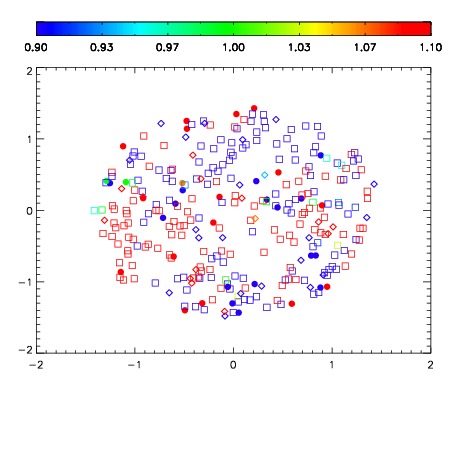
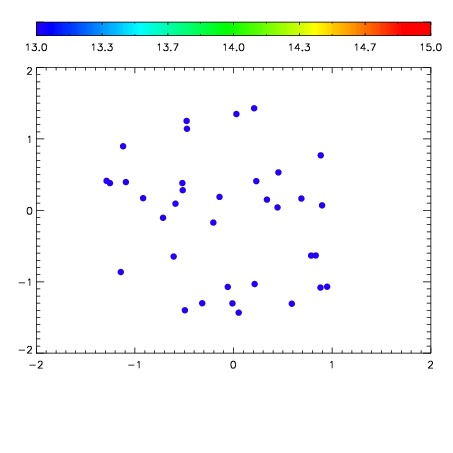

| Frame | Nreads | Zeropoints | Mag plots | Spatial mag deviation | Spatial sky 16325A emission deviations (filled: sky, open: star) | Spatial sky continuum emission | Spatial sky telluric CO2 absorption deviations (filled: H < 10) | |||||||||||||||||||||||
| 0 | 0 |
|
|
|
|
|
|
| IPAIR | NAME | SHIFT | NEWSHIFT | S/N | NAME | SHIFT | NEWSHIFT | S/N |
| 0 | 12110013 | 0.498236 | 0.00000 | 18.3164 | 12110015 | -0.00164031 | 0.499876 | 18.3499 |
| 1 | 12110012 | 0.498077 | 0.000158995 | 18.1443 | 12110011 | 0.00000 | 0.498236 | 18.2133 |
| 2 | 12110016 | 0.497835 | 0.000400990 | 17.9989 | 12110014 | -0.00180182 | 0.500038 | 18.1545 |
| 3 | 12110017 | 0.497310 | 0.000925988 | 17.9617 | 12110018 | -0.00313840 | 0.501374 | 17.9892 |