| Red | Green | Blue | |
| z | 17.64 | ||
| znorm | Inf | ||
| sky | -Inf | -Inf | -Inf |
| S/N | 24.1 | 41.3 | 45.9 |
| S/N(c) | 0.0 | 0.0 | 0.0 |
| SN(E/C) |


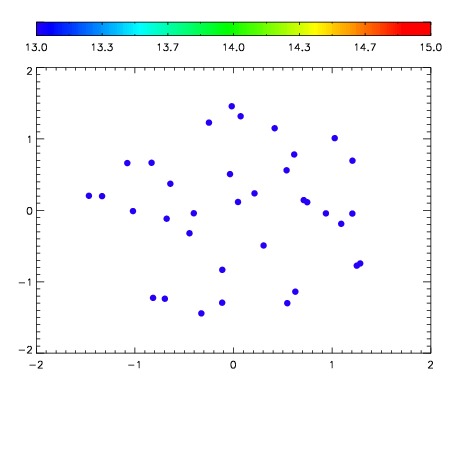

| Frame | Nreads | Zeropoints | Mag plots | Spatial mag deviation | Spatial sky 16325A emission deviations (filled: sky, open: star) | Spatial sky continuum emission | Spatial sky telluric CO2 absorption deviations (filled: H < 10) | |||||||||||||||||||||||
| 0 | 0 |
|
|
|
|
|
|
| IPAIR | NAME | SHIFT | NEWSHIFT | S/N | NAME | SHIFT | NEWSHIFT | S/N |
| 0 | 11930019 | 0.500425 | 0.00000 | 18.8945 | 11930025 | -0.00443759 | 0.504863 | 18.8886 |
| 1 | 11930020 | 0.500225 | 0.000199974 | 18.8830 | 11930018 | 0.00000 | 0.500425 | 18.8788 |
| 2 | 11930024 | 0.500243 | 0.000181973 | 18.8497 | 11930021 | -0.00588417 | 0.506309 | 18.8693 |
| 3 | 11930023 | 0.500187 | 0.000238001 | 18.7258 | 11930022 | -0.00533921 | 0.505764 | 18.8584 |