| Red | Green | Blue | |
| z | 17.64 | ||
| znorm | Inf | ||
| sky | -Inf | -NaN | -Inf |
| S/N | 15.3 | 28.9 | 30.9 |
| S/N(c) | 0.0 | 0.0 | 0.0 |
| SN(E/C) |
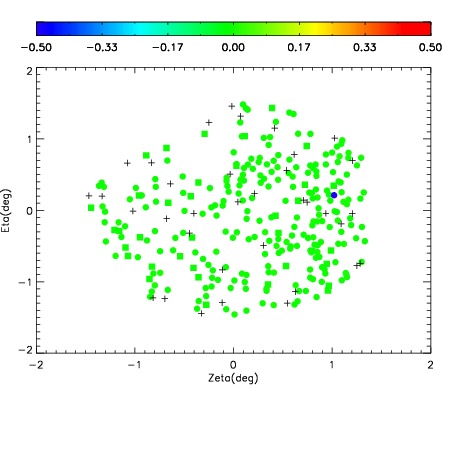
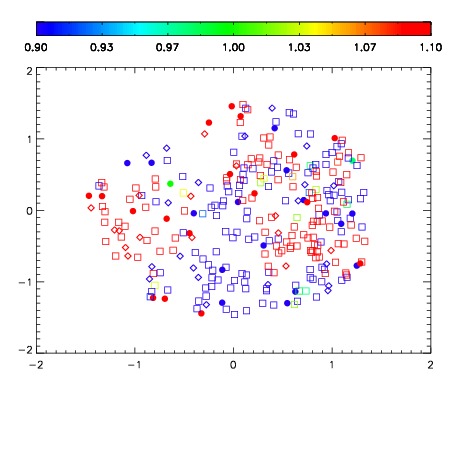
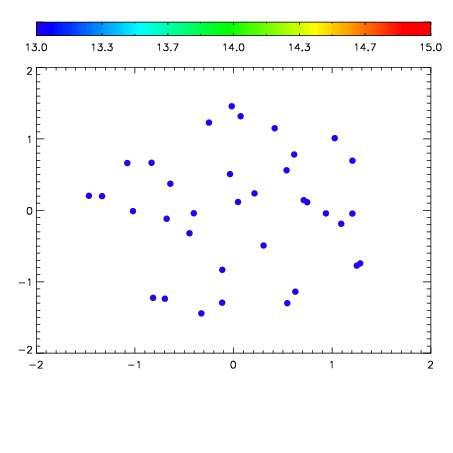

| Frame | Nreads | Zeropoints | Mag plots | Spatial mag deviation | Spatial sky 16325A emission deviations (filled: sky, open: star) | Spatial sky continuum emission | Spatial sky telluric CO2 absorption deviations (filled: H < 10) | |||||||||||||||||||||||
| 0 | 0 |
|
|
|
|
|
|
| IPAIR | NAME | SHIFT | NEWSHIFT | S/N | NAME | SHIFT | NEWSHIFT | S/N |
| 0 | 12150049 | 0.499719 | 0.00000 | 18.4918 | 12150050 | -0.000627916 | 0.500347 | 18.4767 |
| 1 | 12150048 | 0.499453 | 0.000265986 | 18.3963 | 12150047 | 0.00000 | 0.499719 | 18.4469 |
| 2 | 12150053 | 0.498945 | 0.000773996 | 17.5690 | 12150054 | -0.00325402 | 0.502973 | 18.1355 |
| 3 | 12150052 | 0.498918 | 0.000800997 | 17.5312 | 12150051 | -0.000503194 | 0.500222 | 17.9604 |