| Red | Green | Blue | |
| z | 17.64 | ||
| znorm | Inf | ||
| sky | -Inf | -Inf | -Inf |
| S/N | 19.4 | 35.8 | 39.0 |
| S/N(c) | 0.0 | 0.0 | 0.0 |
| SN(E/C) |
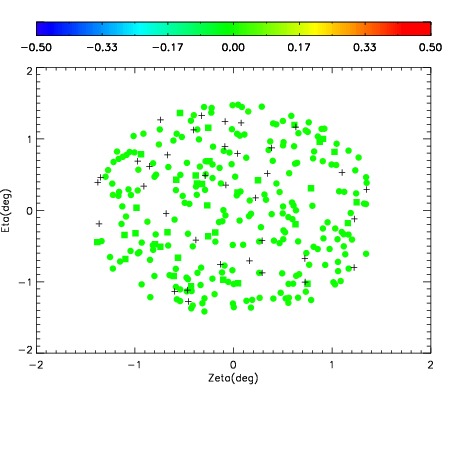
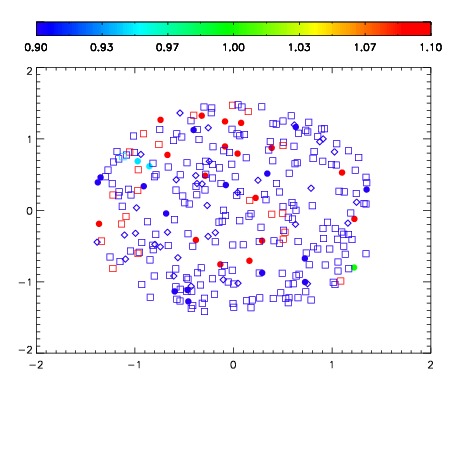


| Frame | Nreads | Zeropoints | Mag plots | Spatial mag deviation | Spatial sky 16325A emission deviations (filled: sky, open: star) | Spatial sky continuum emission | Spatial sky telluric CO2 absorption deviations (filled: H < 10) | |||||||||||||||||||||||
| 0 | 0 |
|
|
|
|
|
|
| IPAIR | NAME | SHIFT | NEWSHIFT | S/N | NAME | SHIFT | NEWSHIFT | S/N |
| 0 | 11670090 | 0.496546 | 0.00000 | 18.5296 | 11670091 | -7.50538e-05 | 0.496621 | 18.3728 |
| 1 | 11670089 | 0.495458 | 0.00108799 | 18.9333 | 11670087 | 0.000467744 | 0.496078 | 18.7488 |
| 2 | 11670086 | 0.493953 | 0.00259301 | 18.6645 | 11670088 | 0.000717954 | 0.495828 | 18.6231 |
| 3 | 11670085 | 0.492945 | 0.00360101 | 18.5340 | 11670084 | 0.00000 | 0.496546 | 18.5237 |