| Red | Green | Blue | |
| z | 17.64 | ||
| znorm | Inf | ||
| sky | -Inf | -Inf | -Inf |
| S/N | 18.2 | 27.9 | 29.0 |
| S/N(c) | 0.0 | 0.0 | 0.0 |
| SN(E/C) |

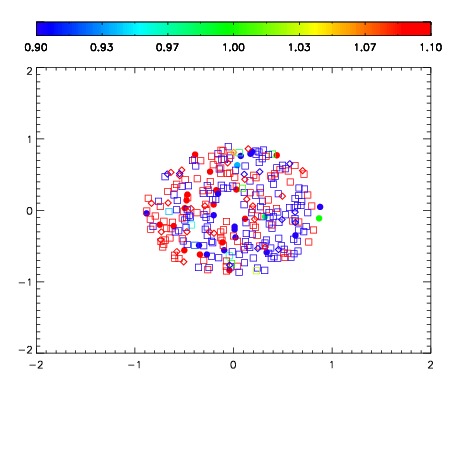


| Frame | Nreads | Zeropoints | Mag plots | Spatial mag deviation | Spatial sky 16325A emission deviations (filled: sky, open: star) | Spatial sky continuum emission | Spatial sky telluric CO2 absorption deviations (filled: H < 10) | |||||||||||||||||||||||
| 0 | 0 |
|
|
|
|
|
|
| IPAIR | NAME | SHIFT | NEWSHIFT | S/N | NAME | SHIFT | NEWSHIFT | S/N |
| 0 | 08710046 | 0.477564 | 0.00000 | 17.8021 | 08710047 | 0.00302425 | 0.474540 | 17.7269 |
| 1 | 08710050 | 0.474913 | 0.00265101 | 18.3031 | 08710044 | 0.00000 | 0.477564 | 18.3721 |
| 2 | 08710045 | 0.475165 | 0.00239900 | 17.9394 | 08710051 | 0.00696339 | 0.470601 | 18.3252 |
| 3 | 08710049 | 0.477114 | 0.000450015 | 17.6845 | 08710048 | 0.00275779 | 0.474806 | 17.7021 |