| Red | Green | Blue | |
| z | 17.63 | ||
| znorm | Inf | ||
| sky | -NaN | -NaN | -NaN |
| S/N | 16.3 | 29.8 | 29.5 |
| S/N(c) | 0.0 | 0.0 | 0.0 |
| SN(E/C) |
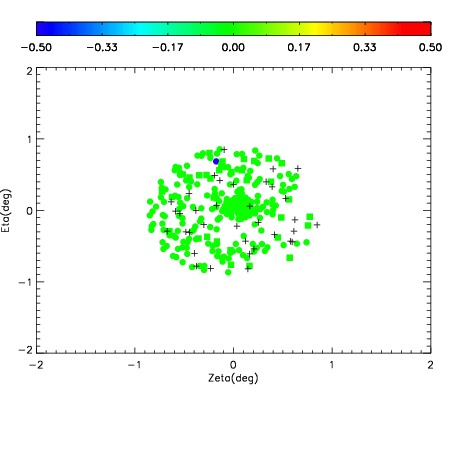


| Frame | Nreads | Zeropoints | Mag plots | Spatial mag deviation | Spatial sky 16325A emission deviations (filled: sky, open: star) | Spatial sky continuum emission | Spatial sky telluric CO2 absorption deviations (filled: H < 10) | |||||||||||||||||||||||
| 0 | 0 |
|
|
|
|
|
|
| IPAIR | NAME | SHIFT | NEWSHIFT | S/N | NAME | SHIFT | NEWSHIFT | S/N |
| 0 | 04590035 | 0.502306 | 0.00000 | 18.2053 | 04590033 | 0.000768353 | 0.501538 | 18.3348 |
| 1 | 04590036 | 0.502205 | 0.000100970 | 18.5805 | 04590037 | 0.00268434 | 0.499622 | 18.7000 |
| 2 | 04590032 | 0.501490 | 0.000815988 | 18.1949 | 04590034 | 0.00241752 | 0.499888 | 18.2154 |
| 3 | 04590031 | 0.498885 | 0.00342098 | 18.0977 | 04590030 | 0.00000 | 0.502306 | 17.9282 |