| Red | Green | Blue | |
| z | 17.64 | ||
| znorm | Inf | ||
| sky | -NaN | -NaN | -Inf |
| S/N | 11.3 | 20.1 | 20.3 |
| S/N(c) | 0.0 | 0.0 | 0.0 |
| SN(E/C) |
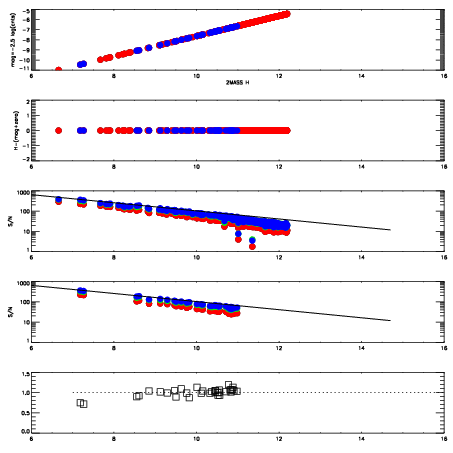
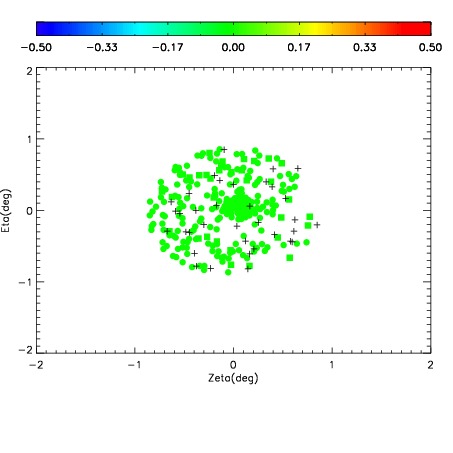
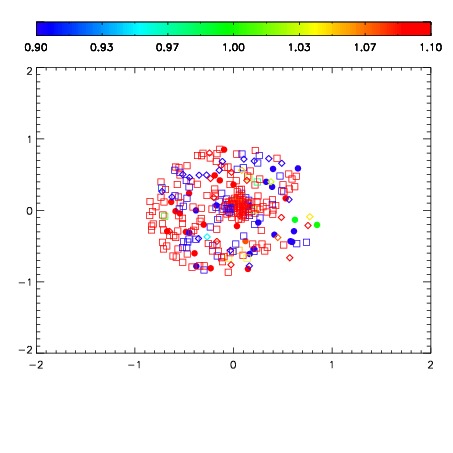


| Frame | Nreads | Zeropoints | Mag plots | Spatial mag deviation | Spatial sky 16325A emission deviations (filled: sky, open: star) | Spatial sky continuum emission | Spatial sky telluric CO2 absorption deviations (filled: H < 10) | |||||||||||||||||||||||
| 0 | 0 |
|
|
|
|
|
|
| IPAIR | NAME | SHIFT | NEWSHIFT | S/N | NAME | SHIFT | NEWSHIFT | S/N |
| 0 | 05470036 | 0.492256 | 0.00000 | 18.1064 | 05470038 | -0.000974679 | 0.493231 | 18.1081 |
| 1 | 05470039 | 0.488561 | 0.00369498 | 18.2736 | 05470037 | -0.00104008 | 0.493296 | 18.3015 |
| 2 | 05470035 | 0.491582 | 0.000673980 | 17.9213 | 05470034 | 0.00000 | 0.492256 | 18.0071 |