| Red | Green | Blue | |
| z | 17.64 | ||
| znorm | Inf | ||
| sky | -Inf | -Inf | -Inf |
| S/N | 14.5 | 25.8 | 25.8 |
| S/N(c) | 0.0 | 0.0 | 0.0 |
| SN(E/C) |
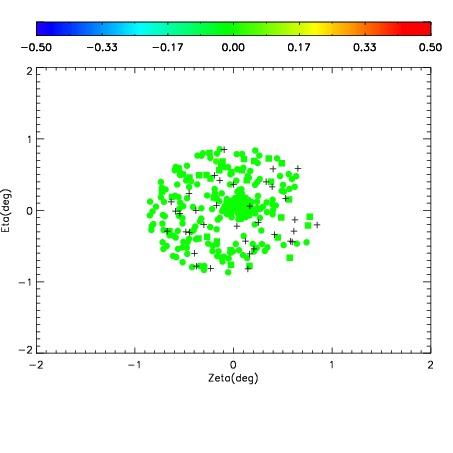
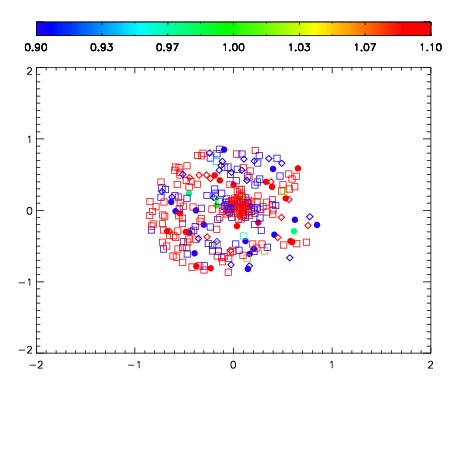


| Frame | Nreads | Zeropoints | Mag plots | Spatial mag deviation | Spatial sky 16325A emission deviations (filled: sky, open: star) | Spatial sky continuum emission | Spatial sky telluric CO2 absorption deviations (filled: H < 10) | |||||||||||||||||||||||
| 0 | 0 |
|
|
|
|
|
|
| IPAIR | NAME | SHIFT | NEWSHIFT | S/N | NAME | SHIFT | NEWSHIFT | S/N |
| 0 | 06050013 | 0.484161 | 0.00000 | 18.3823 | 06050014 | 0.00223536 | 0.481926 | 18.2426 |
| 1 | 06050012 | 0.484058 | 0.000102997 | 18.5483 | 06050011 | 0.00000 | 0.484161 | 18.6087 |
| 2 | 06050016 | 0.481825 | 0.00233600 | 17.7495 | 06050015 | 0.00143284 | 0.482728 | 18.1271 |
| 3 | 06050017 | 0.483040 | 0.00112098 | 17.4448 | 06050018 | 0.00248498 | 0.481676 | 17.0904 |