| Red | Green | Blue | |
| z | 17.63 | ||
| znorm | Inf | ||
| sky | -NaN | -NaN | -NaN |
| S/N | 14.0 | 25.4 | 25.9 |
| S/N(c) | 0.0 | 0.0 | 0.0 |
| SN(E/C) |


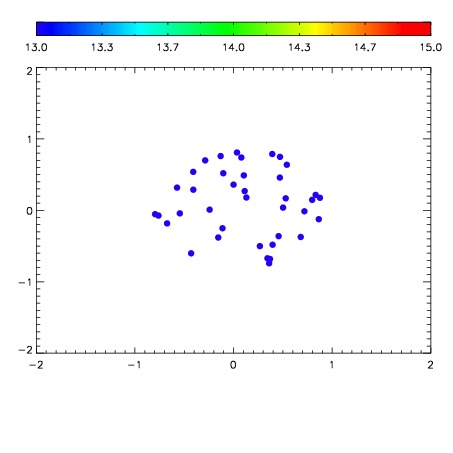

| Frame | Nreads | Zeropoints | Mag plots | Spatial mag deviation | Spatial sky 16325A emission deviations (filled: sky, open: star) | Spatial sky continuum emission | Spatial sky telluric CO2 absorption deviations (filled: H < 10) | |||||||||||||||||||||||
| 0 | 0 |
|
|
|
|
|
|
| IPAIR | NAME | SHIFT | NEWSHIFT | S/N | NAME | SHIFT | NEWSHIFT | S/N |
| 0 | 06070012 | 0.482301 | 0.00000 | 18.1433 | 06070017 | 0.000763873 | 0.481537 | 18.1219 |
| 1 | 06070011 | 0.481686 | 0.000615001 | 18.3851 | 06070010 | 0.00000 | 0.482301 | 18.3521 |
| 2 | 06070016 | 0.479840 | 0.00246099 | 18.1498 | 06070014 | 0.000366025 | 0.481935 | 18.1900 |
| 3 | 06070015 | 0.480253 | 0.00204799 | 18.0942 | 06070013 | 0.00249070 | 0.479810 | 18.0796 |