| Red | Green | Blue | |
| z | 17.63 | ||
| znorm | Inf | ||
| sky | -NaN | -NaN | -NaN |
| S/N | 14.1 | 25.4 | 26.4 |
| S/N(c) | 0.0 | 0.0 | 0.0 |
| SN(E/C) |


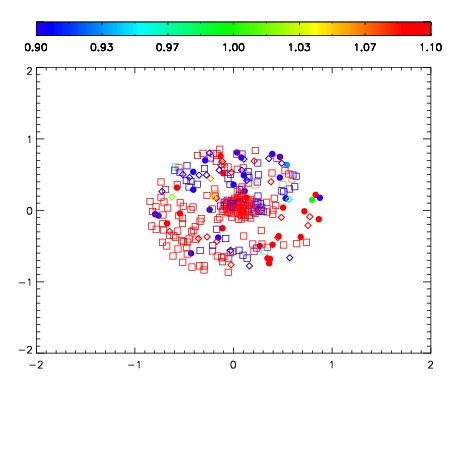


| Frame | Nreads | Zeropoints | Mag plots | Spatial mag deviation | Spatial sky 16325A emission deviations (filled: sky, open: star) | Spatial sky continuum emission | Spatial sky telluric CO2 absorption deviations (filled: H < 10) | |||||||||||||||||||||||
| 0 | 0 |
|
|
|
|
|
|
| IPAIR | NAME | SHIFT | NEWSHIFT | S/N | NAME | SHIFT | NEWSHIFT | S/N |
| 0 | 06080011 | 0.481795 | 0.00000 | 18.3303 | 06080013 | 0.000650303 | 0.481145 | 18.2355 |
| 1 | 06080012 | 0.481730 | 6.49989e-05 | 18.4168 | 06080014 | -0.000883225 | 0.482678 | 18.2410 |
| 2 | 06080016 | 0.480990 | 0.000805020 | 18.2120 | 06080017 | -0.000319657 | 0.482115 | 18.1868 |
| 3 | 06080015 | 0.480880 | 0.000915021 | 18.1946 | 06080010 | 0.00000 | 0.481795 | 18.1274 |