| Red | Green | Blue | |
| z | 17.64 | ||
| znorm | Inf | ||
| sky | -NaN | -NaN | -Inf |
| S/N | 25.3 | 37.0 | 39.0 |
| S/N(c) | 0.0 | 0.0 | 0.0 |
| SN(E/C) |
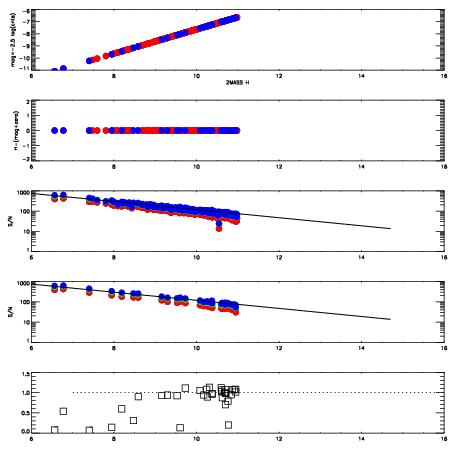


| Frame | Nreads | Zeropoints | Mag plots | Spatial mag deviation | Spatial sky 16325A emission deviations (filled: sky, open: star) | Spatial sky continuum emission | Spatial sky telluric CO2 absorption deviations (filled: H < 10) | |||||||||||||||||||||||
| 0 | 0 |
|
|
|
|
|
|
| IPAIR | NAME | SHIFT | NEWSHIFT | S/N | NAME | SHIFT | NEWSHIFT | S/N |
| 0 | 04680084 | 0.497398 | 0.00000 | 18.6532 | 04680085 | -0.00184691 | 0.499245 | 17.3590 |
| 1 | 04680079 | 0.493964 | 0.00343400 | 18.8269 | 04680078 | 0.00000 | 0.497398 | 18.9151 |
| 2 | 04680083 | 0.496982 | 0.000415981 | 18.7377 | 04680082 | -0.00105360 | 0.498452 | 18.6162 |
| 3 | 04680080 | 0.494948 | 0.00244999 | 18.7055 | 04680081 | -0.000491946 | 0.497890 | 18.1474 |