| Red | Green | Blue | |
| z | 17.64 | ||
| znorm | Inf | ||
| sky | -NaN | -NaN | -NaN |
| S/N | 27.6 | 39.6 | 41.4 |
| S/N(c) | 0.0 | 0.0 | 0.0 |
| SN(E/C) |
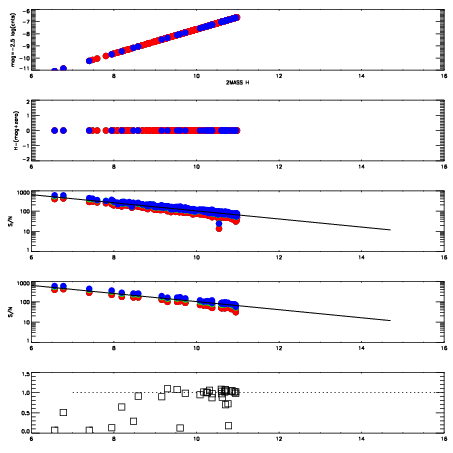
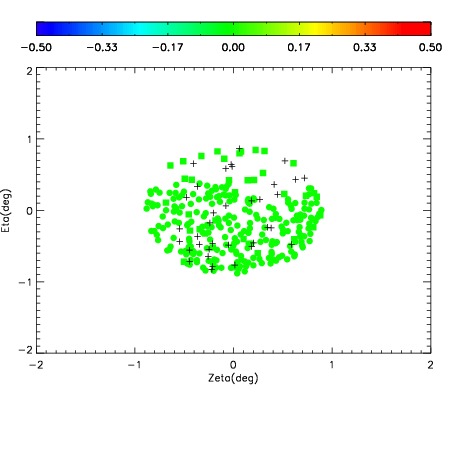

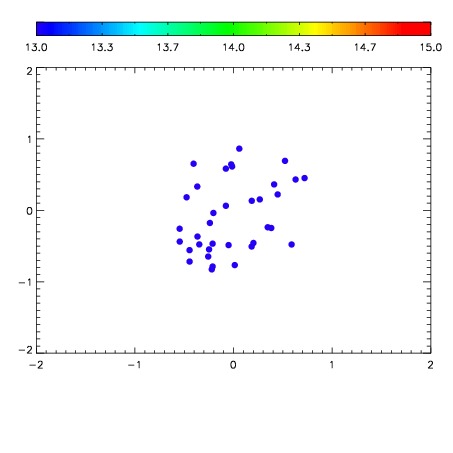

| Frame | Nreads | Zeropoints | Mag plots | Spatial mag deviation | Spatial sky 16325A emission deviations (filled: sky, open: star) | Spatial sky continuum emission | Spatial sky telluric CO2 absorption deviations (filled: H < 10) | |||||||||||||||||||||||
| 0 | 0 |
|
|
|
|
|
|
| IPAIR | NAME | SHIFT | NEWSHIFT | S/N | NAME | SHIFT | NEWSHIFT | S/N |
| 0 | 04710012 | 0.497609 | 0.00000 | 18.8275 | 04710014 | 0.000802599 | 0.496806 | 18.8957 |
| 1 | 04710015 | 0.495249 | 0.00235999 | 18.9068 | 04710010 | 0.00000 | 0.497609 | 18.9719 |
| 2 | 04710011 | 0.496568 | 0.00104100 | 18.8961 | 04710013 | 0.00223094 | 0.495378 | 18.9160 |