| Red | Green | Blue | |
| z | 17.64 | ||
| znorm | Inf | ||
| sky | -Inf | -Inf | -Inf |
| S/N | 27.4 | 40.4 | 43.0 |
| S/N(c) | 0.0 | 0.0 | 0.0 |
| SN(E/C) |
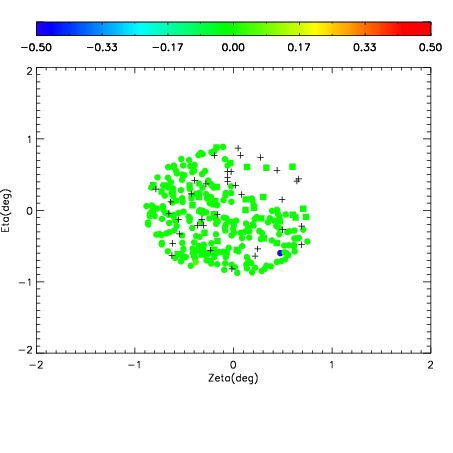
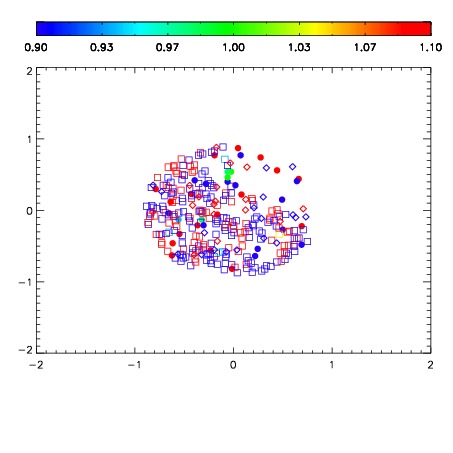


| Frame | Nreads | Zeropoints | Mag plots | Spatial mag deviation | Spatial sky 16325A emission deviations (filled: sky, open: star) | Spatial sky continuum emission | Spatial sky telluric CO2 absorption deviations (filled: H < 10) | |||||||||||||||||||||||
| 0 | 0 |
|
|
|
|
|
|
| IPAIR | NAME | SHIFT | NEWSHIFT | S/N | NAME | SHIFT | NEWSHIFT | S/N |
| 0 | 08820016 | 0.481182 | 0.00000 | 18.5358 | 08820015 | -0.000598611 | 0.481781 | 18.6440 |
| 1 | 08820012 | 0.478065 | 0.00311700 | 18.7832 | 08820018 | 0.00151429 | 0.479668 | 18.7630 |
| 2 | 08820013 | 0.478488 | 0.00269401 | 18.7455 | 08820014 | -0.00135149 | 0.482533 | 18.7544 |
| 3 | 08820017 | 0.481151 | 3.09944e-05 | 18.6852 | 08820011 | 0.00000 | 0.481182 | 18.6932 |