| Red | Green | Blue | |
| z | 17.64 | ||
| znorm | Inf | ||
| sky | -Inf | -NaN | -NaN |
| S/N | 22.2 | 34.2 | 34.8 |
| S/N(c) | 0.0 | 0.0 | 0.0 |
| SN(E/C) |
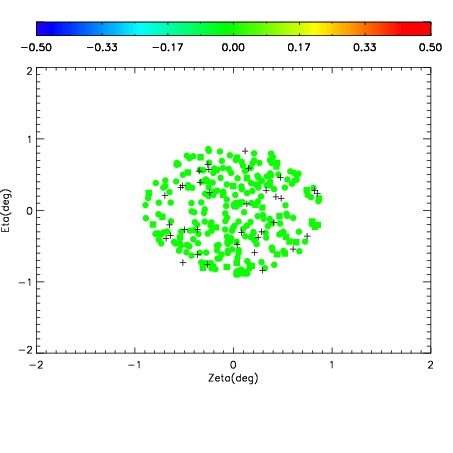
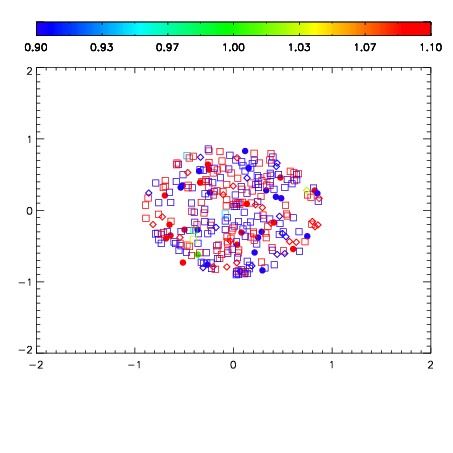
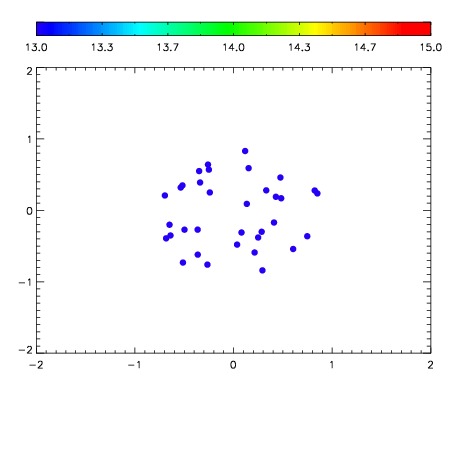

| Frame | Nreads | Zeropoints | Mag plots | Spatial mag deviation | Spatial sky 16325A emission deviations (filled: sky, open: star) | Spatial sky continuum emission | Spatial sky telluric CO2 absorption deviations (filled: H < 10) | |||||||||||||||||||||||
| 0 | 0 |
|
|
|
|
|
|
| IPAIR | NAME | SHIFT | NEWSHIFT | S/N | NAME | SHIFT | NEWSHIFT | S/N |
| 0 | 11980035 | 0.506186 | 0.00000 | 18.1505 | 11980036 | -0.00289064 | 0.509077 | 18.3250 |
| 1 | 11980039 | 0.502450 | 0.00373602 | 18.5112 | 11980040 | -0.00143567 | 0.507622 | 18.6354 |
| 2 | 11980038 | 0.502311 | 0.00387502 | 18.4111 | 11980037 | -0.00373315 | 0.509919 | 18.5759 |
| 3 | 11980034 | 0.504217 | 0.00196898 | 18.2020 | 11980033 | 0.00000 | 0.506186 | 18.3671 |