| Red | Green | Blue | |
| z | 17.64 | ||
| znorm | Inf | ||
| sky | -NaN | -NaN | -NaN |
| S/N | 26.5 | 40.0 | 41.9 |
| S/N(c) | 0.0 | 0.0 | 0.0 |
| SN(E/C) |
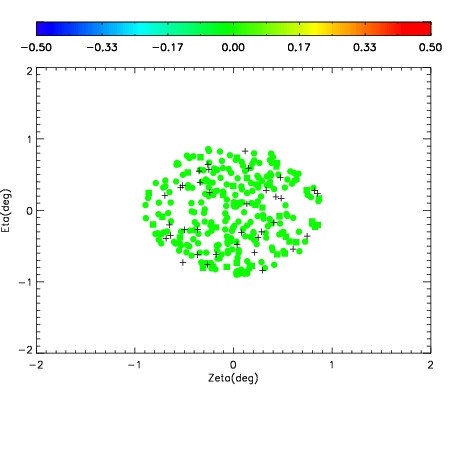
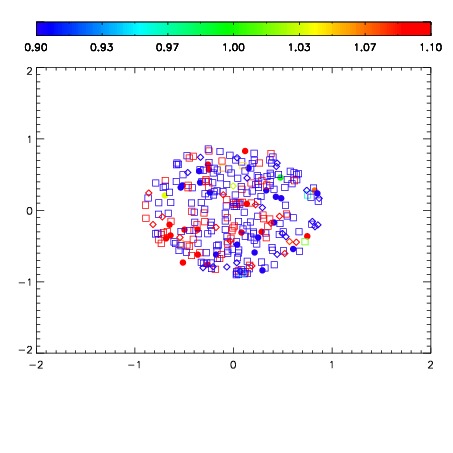
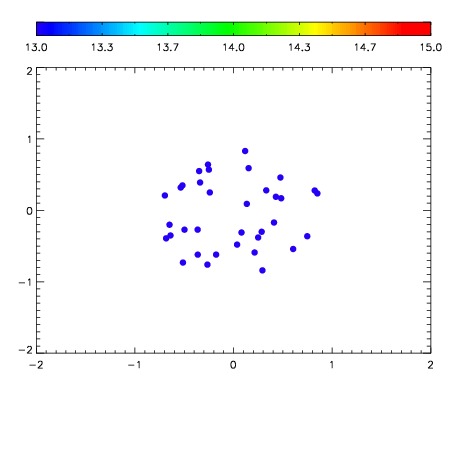

| Frame | Nreads | Zeropoints | Mag plots | Spatial mag deviation | Spatial sky 16325A emission deviations (filled: sky, open: star) | Spatial sky continuum emission | Spatial sky telluric CO2 absorption deviations (filled: H < 10) | |||||||||||||||||||||||
| 0 | 0 |
|
|
|
|
|
|
| IPAIR | NAME | SHIFT | NEWSHIFT | S/N | NAME | SHIFT | NEWSHIFT | S/N |
| 0 | 12070090 | 0.498676 | 0.00000 | 18.4933 | 12070088 | 0.00000 | 0.498676 | 18.3531 |
| 1 | 12070094 | 0.496160 | 0.00251600 | 18.9441 | 12070095 | -0.00154150 | 0.500217 | 18.8327 |
| 2 | 12070093 | 0.497195 | 0.00148100 | 18.8378 | 12070092 | -5.64106e-05 | 0.498732 | 18.7632 |
| 3 | 12070089 | 0.497791 | 0.000885010 | 18.4949 | 12070091 | 0.000196915 | 0.498479 | 18.5548 |