| Red | Green | Blue | |
| z | 17.64 | ||
| znorm | Inf | ||
| sky | -Inf | -Inf | -Inf |
| S/N | 30.6 | 44.5 | 47.2 |
| S/N(c) | 0.0 | 0.0 | 0.0 |
| SN(E/C) |
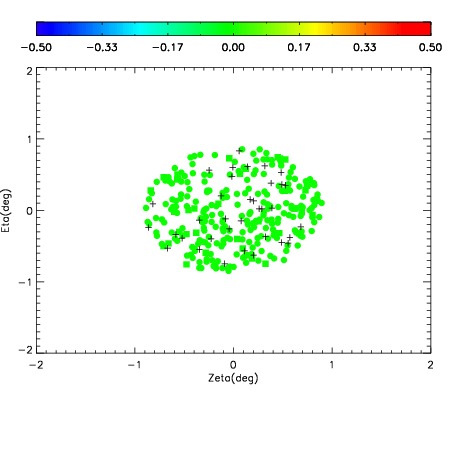
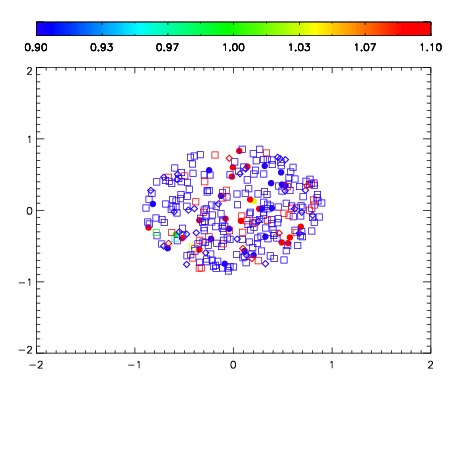
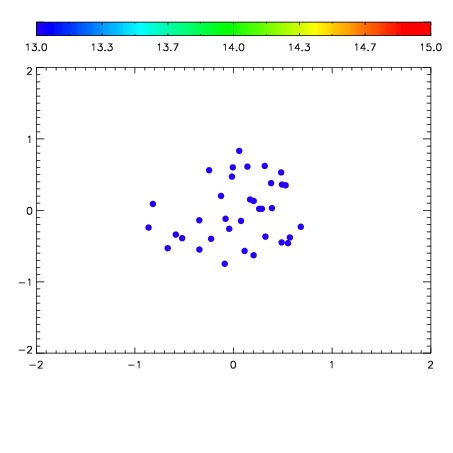

| Frame | Nreads | Zeropoints | Mag plots | Spatial mag deviation | Spatial sky 16325A emission deviations (filled: sky, open: star) | Spatial sky continuum emission | Spatial sky telluric CO2 absorption deviations (filled: H < 10) | |||||||||||||||||||||||
| 0 | 0 |
|
|
|
|
|
|
| IPAIR | NAME | SHIFT | NEWSHIFT | S/N | NAME | SHIFT | NEWSHIFT | S/N |
| 0 | 08410083 | 0.500259 | 0.00000 | 18.8441 | 08410084 | 0.000803666 | 0.499455 | 18.8774 |
| 1 | 08410087 | 0.484704 | 0.0155550 | 18.9596 | 08410088 | -0.0125353 | 0.512794 | 18.9343 |
| 2 | 08410086 | 0.484103 | 0.0161560 | 18.9209 | 08410085 | 0.000826146 | 0.499433 | 18.9146 |
| 3 | 08410082 | 0.499894 | 0.000364989 | 18.7947 | 08410081 | 0.00000 | 0.500259 | 18.7261 |