| Red | Green | Blue | |
| z | 17.64 | ||
| znorm | Inf | ||
| sky | -NaN | -NaN | -NaN |
| S/N | 26.6 | 39.5 | 40.4 |
| S/N(c) | 0.0 | 0.0 | 0.0 |
| SN(E/C) |
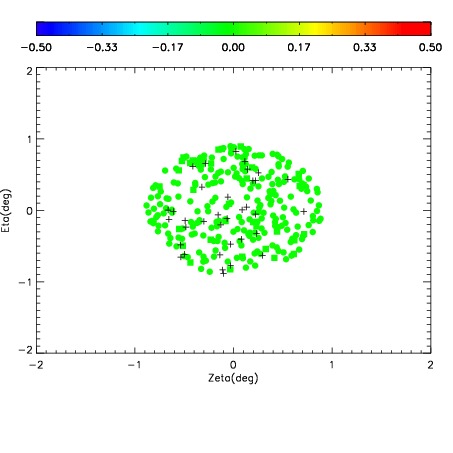
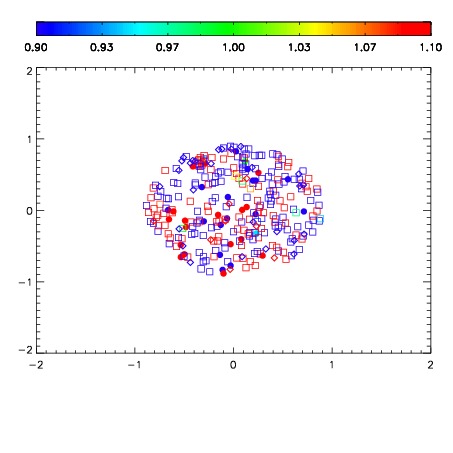
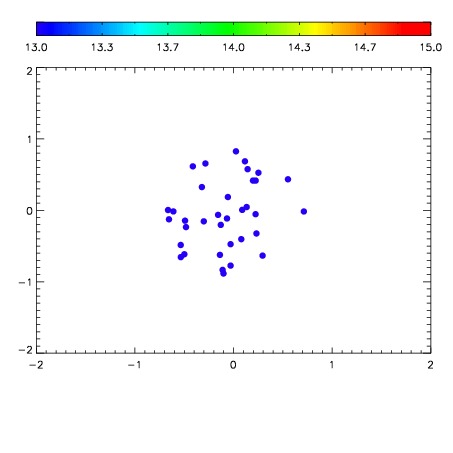

| Frame | Nreads | Zeropoints | Mag plots | Spatial mag deviation | Spatial sky 16325A emission deviations (filled: sky, open: star) | Spatial sky continuum emission | Spatial sky telluric CO2 absorption deviations (filled: H < 10) | |||||||||||||||||||||||
| 0 | 0 |
|
|
|
|
|
|
| IPAIR | NAME | SHIFT | NEWSHIFT | S/N | NAME | SHIFT | NEWSHIFT | S/N |
| 0 | 12090072 | 0.489917 | 0.00000 | 18.8144 | 12090074 | -0.00343795 | 0.493355 | 18.8643 |
| 1 | 12090076 | 0.486638 | 0.00327900 | 18.9660 | 12090075 | -0.00346079 | 0.493378 | 18.9214 |
| 2 | 12090073 | 0.489844 | 7.30157e-05 | 18.7861 | 12090071 | 0.00000 | 0.489917 | 18.7966 |