| Red | Green | Blue | |
| z | 17.64 | ||
| znorm | Inf | ||
| sky | -Inf | -Inf | -Inf |
| S/N | 24.7 | 35.8 | 38.0 |
| S/N(c) | 0.0 | 0.0 | 0.0 |
| SN(E/C) |
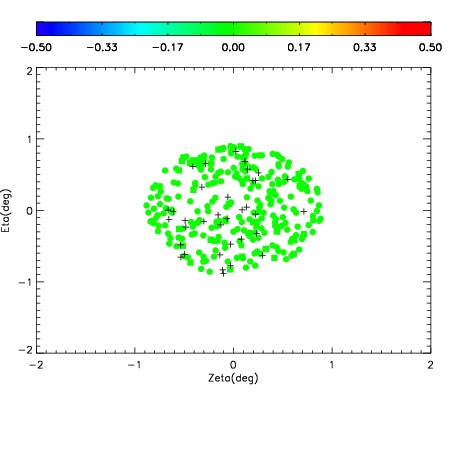
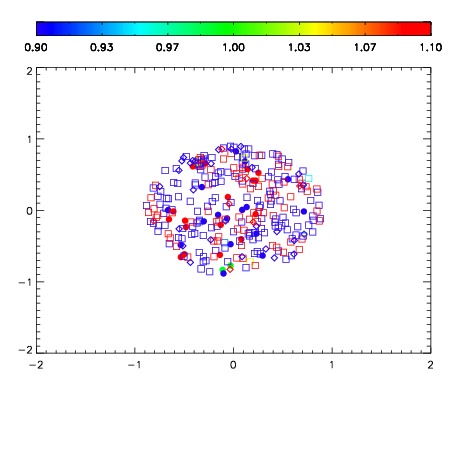
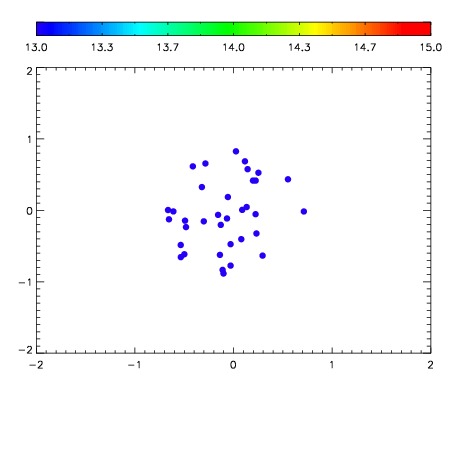

| Frame | Nreads | Zeropoints | Mag plots | Spatial mag deviation | Spatial sky 16325A emission deviations (filled: sky, open: star) | Spatial sky continuum emission | Spatial sky telluric CO2 absorption deviations (filled: H < 10) | |||||||||||||||||||||||
| 0 | 0 |
|
|
|
|
|
|
| IPAIR | NAME | SHIFT | NEWSHIFT | S/N | NAME | SHIFT | NEWSHIFT | S/N |
| 0 | 12330046 | 0.494114 | 0.00000 | 17.8180 | 12330044 | 0.00000 | 0.494114 | 17.9156 |
| 1 | 12330049 | 0.489713 | 0.00440100 | 18.9628 | 12330048 | -0.00408011 | 0.498194 | 18.9913 |
| 2 | 12330050 | 0.491820 | 0.00229400 | 18.5352 | 12330047 | -0.00354849 | 0.497663 | 18.9715 |
| 3 | 12330045 | 0.492278 | 0.00183600 | 18.3114 | 12330051 | 0.000979177 | 0.493135 | 18.7261 |