| Red | Green | Blue | |
| z | 17.64 | ||
| znorm | Inf | ||
| sky | -Inf | -NaN | -Inf |
| S/N | 34.4 | 50.4 | 54.9 |
| S/N(c) | 0.0 | 0.0 | 0.0 |
| SN(E/C) |
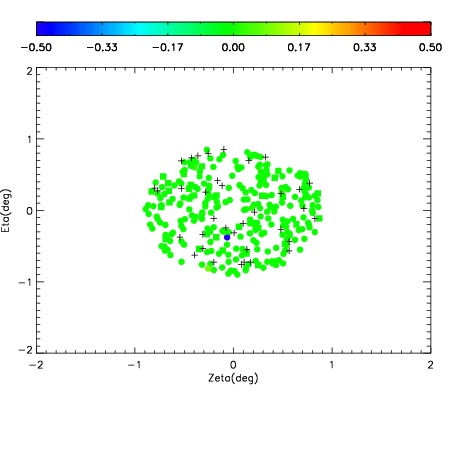
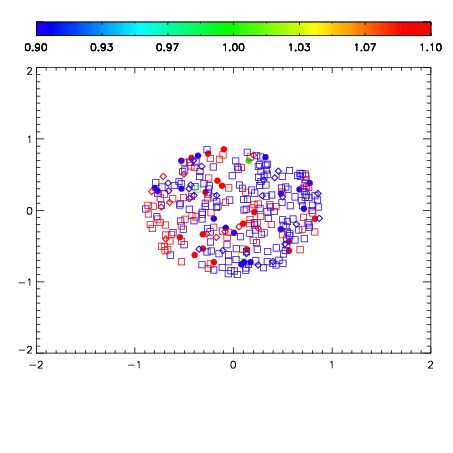


| Frame | Nreads | Zeropoints | Mag plots | Spatial mag deviation | Spatial sky 16325A emission deviations (filled: sky, open: star) | Spatial sky continuum emission | Spatial sky telluric CO2 absorption deviations (filled: H < 10) | |||||||||||||||||||||||
| 0 | 0 |
|
|
|
|
|
|
| IPAIR | NAME | SHIFT | NEWSHIFT | S/N | NAME | SHIFT | NEWSHIFT | S/N |
| 0 | 04600086 | 0.496247 | 0.00000 | 19.1657 | 04600087 | 6.24566e-05 | 0.496185 | 19.1819 |
| 1 | 04600085 | 0.494452 | 0.00179499 | 19.0744 | 04600080 | 0.00000 | 0.496247 | 19.0949 |
| 2 | 04600082 | 0.495373 | 0.000873983 | 19.0536 | 04600084 | -0.000984788 | 0.497232 | 19.0345 |
| 3 | 04600081 | 0.495288 | 0.000958979 | 19.0437 | 04600083 | 0.000199704 | 0.496047 | 18.9893 |