| Red | Green | Blue | |
| z | 17.64 | ||
| znorm | Inf | ||
| sky | -NaN | -NaN | -Inf |
| S/N | 30.2 | 43.1 | 41.7 |
| S/N(c) | 0.0 | 0.0 | 0.0 |
| SN(E/C) |


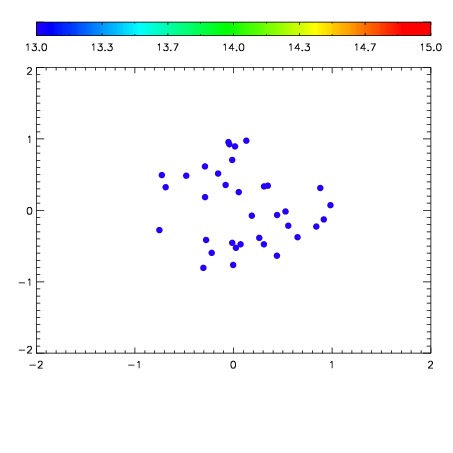

| Frame | Nreads | Zeropoints | Mag plots | Spatial mag deviation | Spatial sky 16325A emission deviations (filled: sky, open: star) | Spatial sky continuum emission | Spatial sky telluric CO2 absorption deviations (filled: H < 10) | |||||||||||||||||||||||
| 0 | 0 |
|
|
|
|
|
|
| IPAIR | NAME | SHIFT | NEWSHIFT | S/N | NAME | SHIFT | NEWSHIFT | S/N |
| 0 | 11950082 | 0.499500 | 0.00000 | 18.6658 | 11950083 | -0.00176067 | 0.501261 | 18.6350 |
| 1 | 11950086 | 0.497384 | 0.00211599 | 18.6870 | 11950087 | -0.00392440 | 0.503424 | 18.8088 |
| 2 | 11950081 | 0.499413 | 8.69930e-05 | 18.6703 | 11950080 | 0.00000 | 0.499500 | 18.7415 |
| 3 | 11950085 | 0.498209 | 0.00129101 | 18.5371 | 11950084 | -0.00170362 | 0.501204 | 18.4909 |