| Red | Green | Blue | |
| z | 17.64 | ||
| znorm | Inf | ||
| sky | -NaN | -NaN | -Inf |
| S/N | 35.1 | 48.1 | 51.5 |
| S/N(c) | 0.0 | 0.0 | 0.0 |
| SN(E/C) |


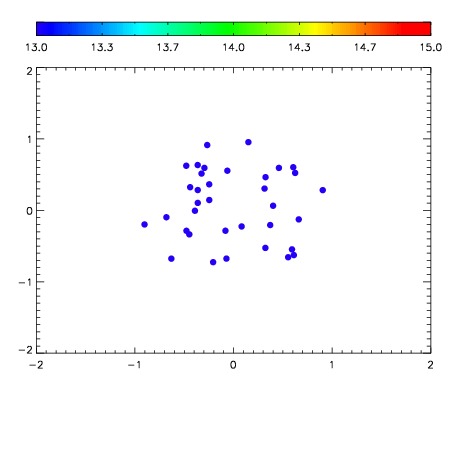

| Frame | Nreads | Zeropoints | Mag plots | Spatial mag deviation | Spatial sky 16325A emission deviations (filled: sky, open: star) | Spatial sky continuum emission | Spatial sky telluric CO2 absorption deviations (filled: H < 10) | |||||||||||||||||||||||
| 0 | 0 |
|
|
|
|
|
|
| IPAIR | NAME | SHIFT | NEWSHIFT | S/N | NAME | SHIFT | NEWSHIFT | S/N |
| 0 | 05230064 | 0.493548 | 0.00000 | 19.1146 | 05230062 | 0.00488896 | 0.488659 | 19.1044 |
| 1 | 05230059 | 0.489368 | 0.00418001 | 19.1901 | 05230058 | 0.00000 | 0.493548 | 19.1725 |
| 2 | 05230060 | 0.490631 | 0.00291699 | 19.1329 | 05230065 | 0.00721768 | 0.486330 | 19.1084 |
| 3 | 05230063 | 0.492983 | 0.000564992 | 19.0719 | 05230061 | 0.00431346 | 0.489235 | 19.0076 |