| Red | Green | Blue | |
| z | 17.64 | ||
| znorm | Inf | ||
| sky | -Inf | -Inf | -NaN |
| S/N | 31.9 | 45.5 | 47.1 |
| S/N(c) | 0.0 | 0.0 | 0.0 |
| SN(E/C) |

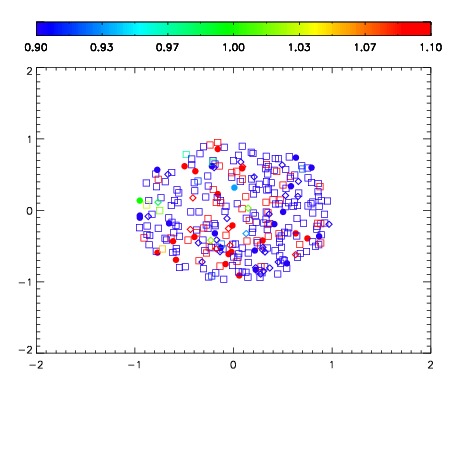
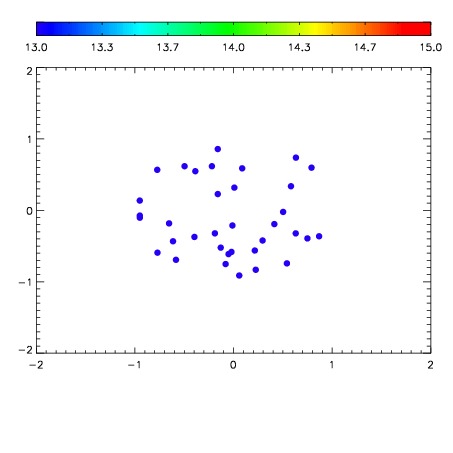

| Frame | Nreads | Zeropoints | Mag plots | Spatial mag deviation | Spatial sky 16325A emission deviations (filled: sky, open: star) | Spatial sky continuum emission | Spatial sky telluric CO2 absorption deviations (filled: H < 10) | |||||||||||||||||||||||
| 0 | 0 |
|
|
|
|
|
|
| IPAIR | NAME | SHIFT | NEWSHIFT | S/N | NAME | SHIFT | NEWSHIFT | S/N |
| 0 | 04790015 | 0.488710 | 0.00000 | 19.1162 | 04790014 | 0.000975546 | 0.487734 | 19.1255 |
| 1 | 04790012 | 0.488313 | 0.000396997 | 19.1054 | 04790013 | -0.00558267 | 0.494293 | 19.1204 |
| 2 | 04790011 | 0.488046 | 0.000663996 | 19.0953 | 04790010 | 0.00000 | 0.488710 | 19.0535 |