| Red | Green | Blue | |
| z | 17.64 | ||
| znorm | Inf | ||
| sky | -Inf | -Inf | -Inf |
| S/N | 23.9 | 41.5 | 44.1 |
| S/N(c) | 0.0 | 0.0 | 0.0 |
| SN(E/C) |
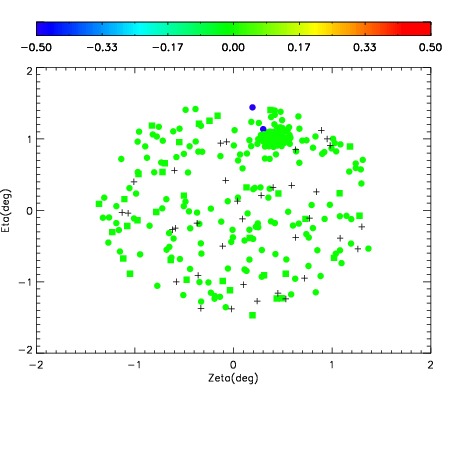
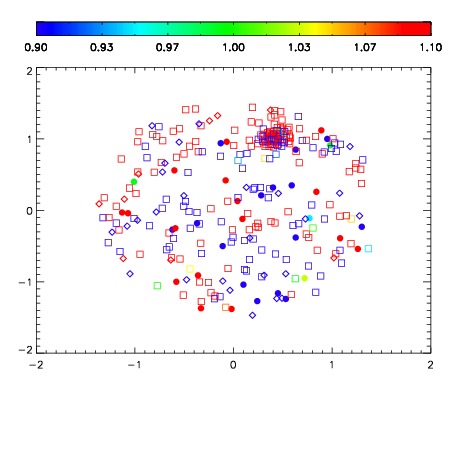
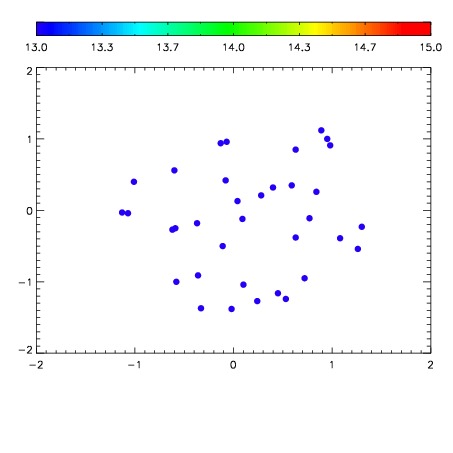

| Frame | Nreads | Zeropoints | Mag plots | Spatial mag deviation | Spatial sky 16325A emission deviations (filled: sky, open: star) | Spatial sky continuum emission | Spatial sky telluric CO2 absorption deviations (filled: H < 10) | |||||||||||||||||||||||
| 0 | 0 |
|
|
|
|
|
|
| IPAIR | NAME | SHIFT | NEWSHIFT | S/N | NAME | SHIFT | NEWSHIFT | S/N |
| 0 | 04910053 | 0.488022 | 0.00000 | 18.8033 | 04910047 | 0.00000 | 0.488022 | 18.7852 |
| 1 | 04910049 | 0.486258 | 0.00176400 | 19.1131 | 04910050 | -7.71029e-05 | 0.488099 | 19.0862 |
| 2 | 04910052 | 0.486001 | 0.00202098 | 19.0435 | 04910051 | -0.000419173 | 0.488441 | 19.0733 |
| 3 | 04910048 | 0.486560 | 0.00146201 | 18.9397 | 04910054 | -7.06165e-05 | 0.488093 | 18.9359 |