| Red | Green | Blue | |
| z | 17.64 | ||
| znorm | Inf | ||
| sky | -Inf | -Inf | -Inf |
| S/N | 24.4 | 44.2 | 46.1 |
| S/N(c) | 0.0 | 0.0 | 0.0 |
| SN(E/C) |


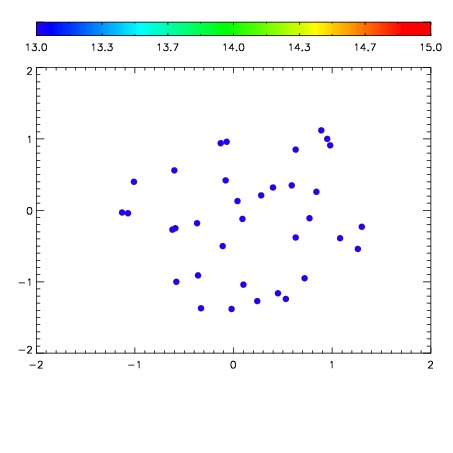

| Frame | Nreads | Zeropoints | Mag plots | Spatial mag deviation | Spatial sky 16325A emission deviations (filled: sky, open: star) | Spatial sky continuum emission | Spatial sky telluric CO2 absorption deviations (filled: H < 10) | |||||||||||||||||||||||
| 0 | 0 |
|
|
|
|
|
|
| IPAIR | NAME | SHIFT | NEWSHIFT | S/N | NAME | SHIFT | NEWSHIFT | S/N |
| 0 | 05440012 | 0.480291 | 0.00000 | 18.9630 | 05440011 | 0.00000 | 0.480291 | 18.9275 |
| 1 | 05440016 | 0.478740 | 0.00155100 | 19.0229 | 05440014 | -0.00467962 | 0.484971 | 19.0131 |
| 2 | 05440017 | 0.479964 | 0.000327021 | 19.0089 | 05440018 | -0.00350782 | 0.483799 | 19.0101 |
| 3 | 05440013 | 0.479932 | 0.000358999 | 18.9695 | 05440015 | -0.00488876 | 0.485180 | 19.0028 |