| Red | Green | Blue | |
| z | 17.64 | ||
| znorm | Inf | ||
| sky | -Inf | -Inf | -Inf |
| S/N | 23.1 | 39.5 | 42.2 |
| S/N(c) | 0.0 | 0.0 | 0.0 |
| SN(E/C) |
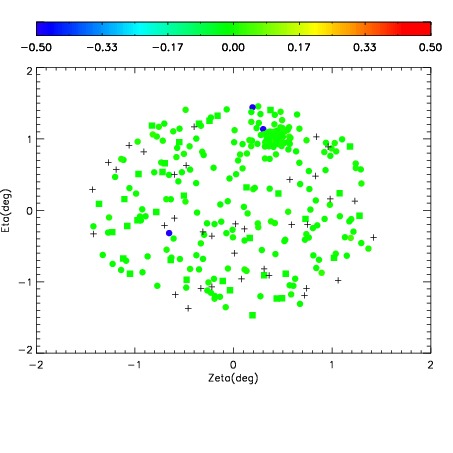
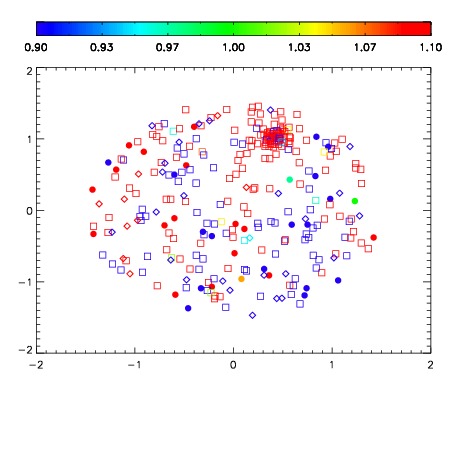


| Frame | Nreads | Zeropoints | Mag plots | Spatial mag deviation | Spatial sky 16325A emission deviations (filled: sky, open: star) | Spatial sky continuum emission | Spatial sky telluric CO2 absorption deviations (filled: H < 10) | |||||||||||||||||||||||
| 0 | 0 |
|
|
|
|
|
|
| IPAIR | NAME | SHIFT | NEWSHIFT | S/N | NAME | SHIFT | NEWSHIFT | S/N |
| 0 | 04920053 | 0.495884 | 0.00000 | 18.8939 | 04920051 | 0.00502424 | 0.490860 | 18.6771 |
| 1 | 04920049 | 0.493803 | 0.00208101 | 19.1081 | 04920047 | 0.00000 | 0.495884 | 19.0698 |
| 2 | 04920048 | 0.492117 | 0.00376701 | 19.1017 | 04920050 | 0.00547926 | 0.490405 | 19.0550 |
| 3 | 04920052 | 0.493933 | 0.00195101 | 18.7318 | 04920054 | 0.00494547 | 0.490939 | 18.0489 |