| Red | Green | Blue | |
| z | 17.65 | ||
| znorm | Inf | ||
| sky | -Inf | -Inf | -Inf |
| S/N | 19.8 | 36.0 | 37.4 |
| S/N(c) | 0.0 | 0.0 | 0.0 |
| SN(E/C) |

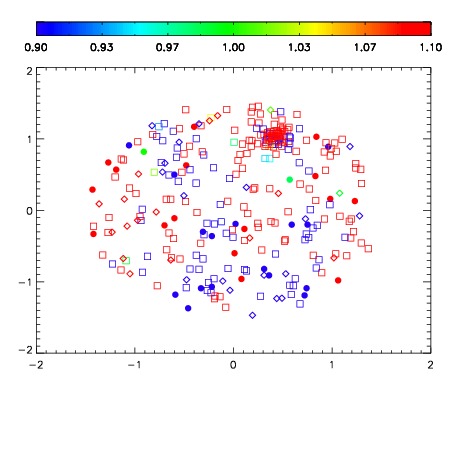


| Frame | Nreads | Zeropoints | Mag plots | Spatial mag deviation | Spatial sky 16325A emission deviations (filled: sky, open: star) | Spatial sky continuum emission | Spatial sky telluric CO2 absorption deviations (filled: H < 10) | |||||||||||||||||||||||
| 0 | 0 |
|
|
|
|
|
|
| IPAIR | NAME | SHIFT | NEWSHIFT | S/N | NAME | SHIFT | NEWSHIFT | S/N |
| 0 | 05470010 | 0.492633 | 0.00000 | 18.6920 | 05470008 | 0.00000 | 0.492633 | 18.7225 |
| 1 | 05470009 | 0.491861 | 0.000771999 | 18.6354 | 05470011 | -0.00153434 | 0.494167 | 18.6933 |
| 2 | 05470014 | 0.488914 | 0.00371897 | 18.5227 | 05470015 | -0.00255510 | 0.495188 | 18.6551 |
| 3 | 05470013 | 0.488365 | 0.00426799 | 18.4995 | 05470012 | -0.00360081 | 0.496234 | 18.2691 |