| Red | Green | Blue | |
| z | 17.64 | ||
| znorm | Inf | ||
| sky | -Inf | -Inf | -Inf |
| S/N | 22.1 | 39.9 | 42.1 |
| S/N(c) | 0.0 | 0.0 | 0.0 |
| SN(E/C) |
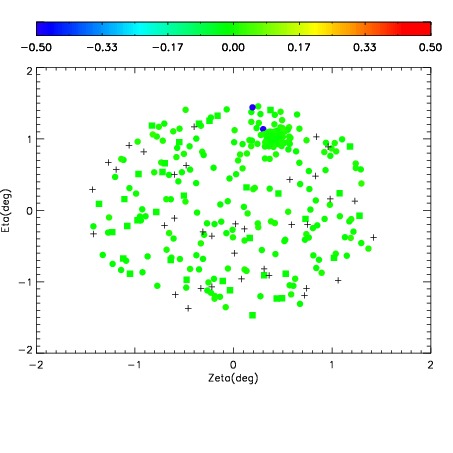
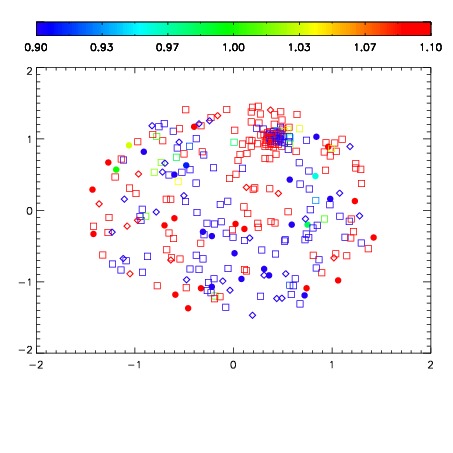


| Frame | Nreads | Zeropoints | Mag plots | Spatial mag deviation | Spatial sky 16325A emission deviations (filled: sky, open: star) | Spatial sky continuum emission | Spatial sky telluric CO2 absorption deviations (filled: H < 10) | |||||||||||||||||||||||
| 0 | 0 |
|
|
|
|
|
|
| IPAIR | NAME | SHIFT | NEWSHIFT | S/N | NAME | SHIFT | NEWSHIFT | S/N |
| 0 | 07830099 | 0.471142 | 0.00000 | 18.7167 | 07830097 | -0.00523339 | 0.476375 | 18.7093 |
| 1 | 07830098 | 0.470876 | 0.000265986 | 18.7314 | 07830100 | -0.00533209 | 0.476474 | 18.7983 |
| 2 | 07830095 | 0.471048 | 9.39965e-05 | 18.6051 | 07830096 | 0.000652971 | 0.470489 | 18.5676 |
| 3 | 07830094 | 0.470897 | 0.000245005 | 18.4764 | 07830093 | 0.00000 | 0.471142 | 18.2666 |