| Red | Green | Blue | |
| z | 17.65 | ||
| znorm | Inf | ||
| sky | -Inf | -Inf | -Inf |
| S/N | 18.5 | 34.6 | 36.5 |
| S/N(c) | 0.0 | 0.0 | 0.0 |
| SN(E/C) |


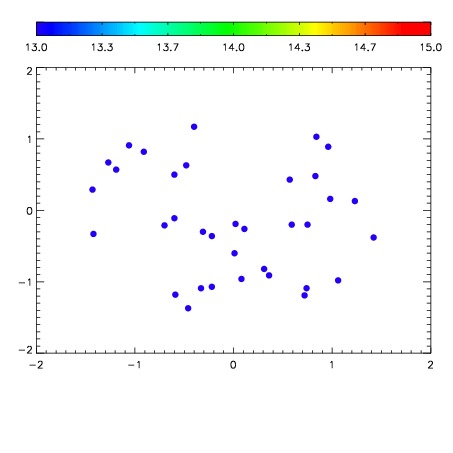

| Frame | Nreads | Zeropoints | Mag plots | Spatial mag deviation | Spatial sky 16325A emission deviations (filled: sky, open: star) | Spatial sky continuum emission | Spatial sky telluric CO2 absorption deviations (filled: H < 10) | |||||||||||||||||||||||
| 0 | 0 |
|
|
|
|
|
|
| IPAIR | NAME | SHIFT | NEWSHIFT | S/N | NAME | SHIFT | NEWSHIFT | S/N |
| 0 | 07840073 | 0.475632 | 0.00000 | 18.5396 | 07840075 | -0.00300576 | 0.478638 | 18.4862 |
| 1 | 07840077 | 0.475071 | 0.000560999 | 18.4652 | 07840078 | -0.00187027 | 0.477502 | 18.4334 |
| 2 | 07840076 | 0.473240 | 0.00239202 | 18.4214 | 07840074 | -0.00200097 | 0.477633 | 18.4280 |
| 3 | 07840072 | 0.475197 | 0.000435024 | 18.2353 | 07840071 | 0.00000 | 0.475632 | 18.3083 |