| Red | Green | Blue | |
| z | 17.64 | ||
| znorm | Inf | ||
| sky | -Inf | -Inf | -Inf |
| S/N | 25.9 | 46.6 | 50.2 |
| S/N(c) | 0.0 | 0.0 | 0.0 |
| SN(E/C) |
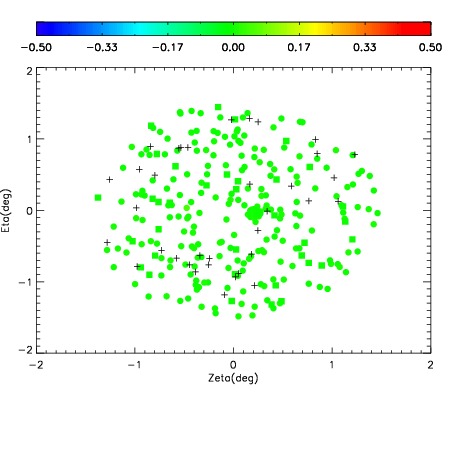
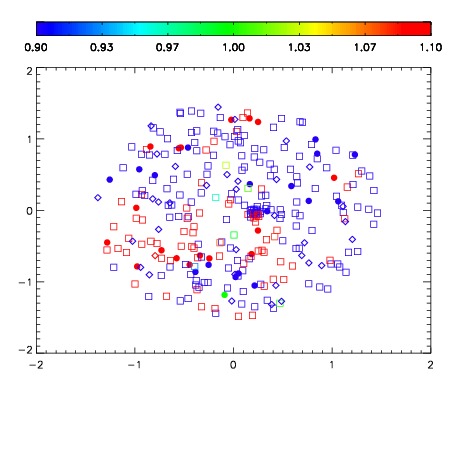
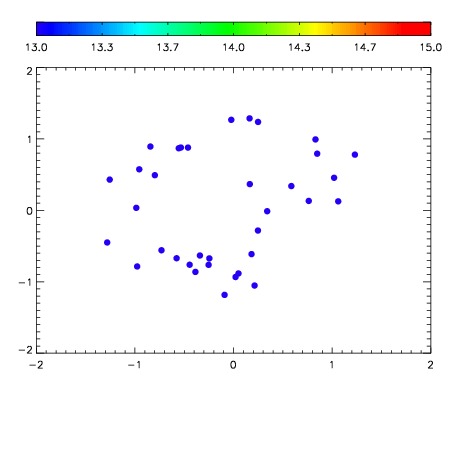

| Frame | Nreads | Zeropoints | Mag plots | Spatial mag deviation | Spatial sky 16325A emission deviations (filled: sky, open: star) | Spatial sky continuum emission | Spatial sky telluric CO2 absorption deviations (filled: H < 10) | |||||||||||||||||||||||
| 0 | 0 |
|
|
|
|
|
|
| IPAIR | NAME | SHIFT | NEWSHIFT | S/N | NAME | SHIFT | NEWSHIFT | S/N |
| 0 | 04900075 | 0.483993 | 0.00000 | 19.0587 | 04900073 | 0.00147802 | 0.482515 | 19.1235 |
| 1 | 04900071 | 0.483518 | 0.000474989 | 19.1347 | 04900072 | 0.000902908 | 0.483090 | 19.1568 |
| 2 | 04900074 | 0.483112 | 0.000880986 | 19.0863 | 04900076 | -0.000256258 | 0.484249 | 19.1564 |
| 3 | 04900070 | 0.482894 | 0.00109899 | 19.0408 | 04900069 | 0.00000 | 0.483993 | 19.0022 |