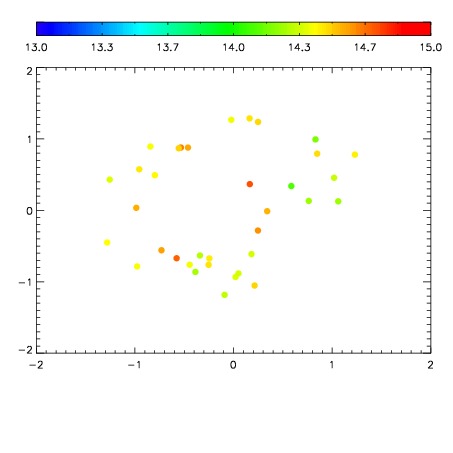
| Frame | Nreads | Zeropoints | Mag plots
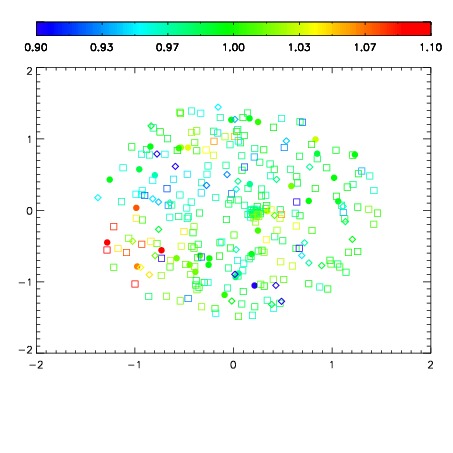
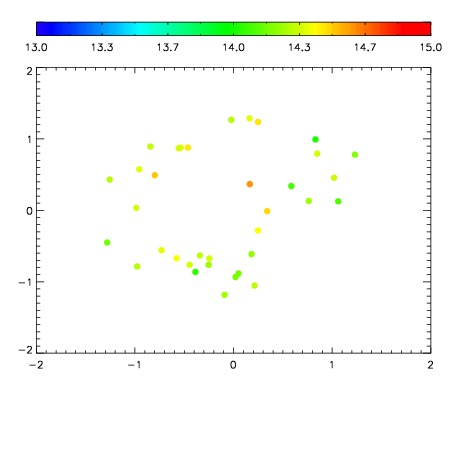
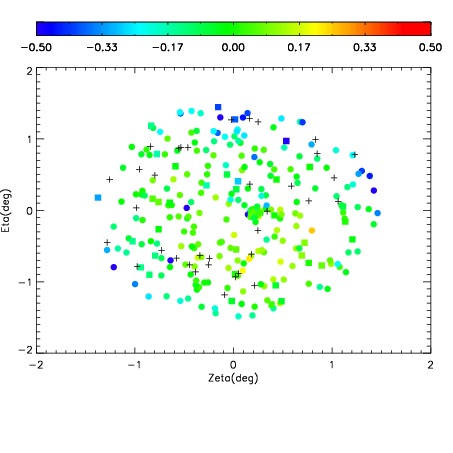
| Spatial mag deviation
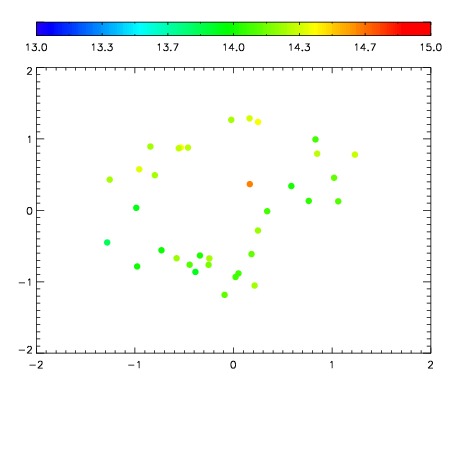
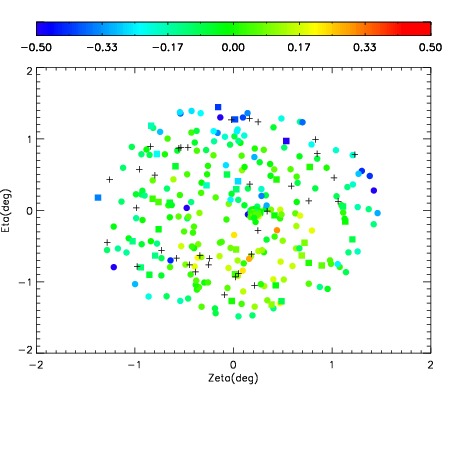
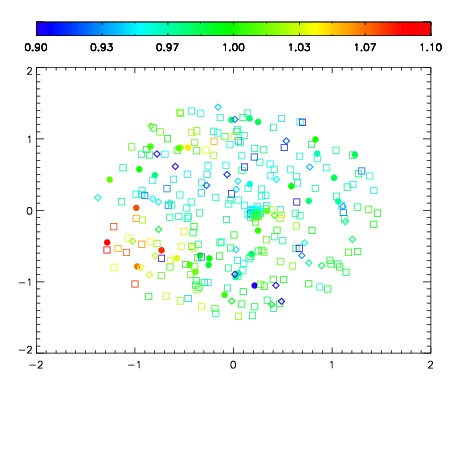
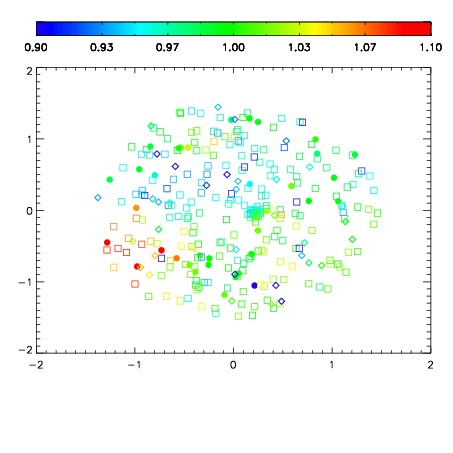
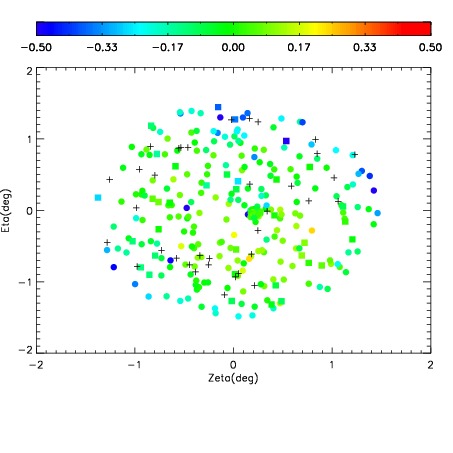
| Spatial sky 16325A emission deviations (filled: sky, open: star)
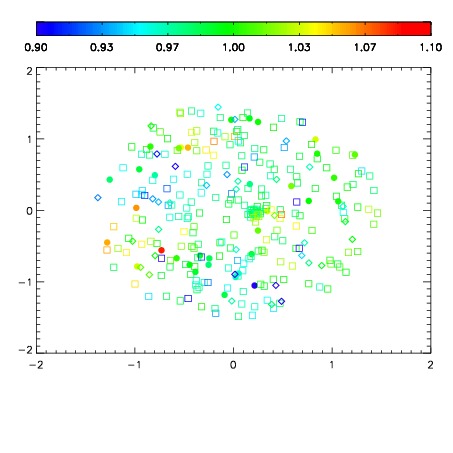
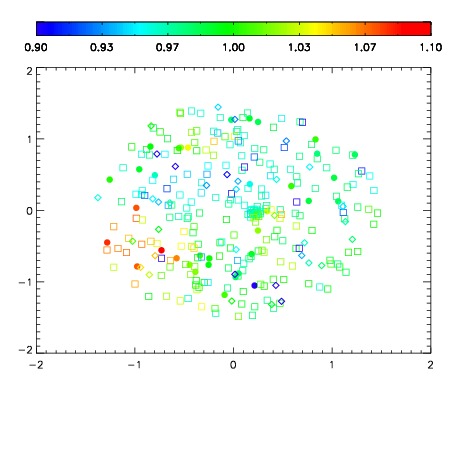
| Spatial sky continuum emission
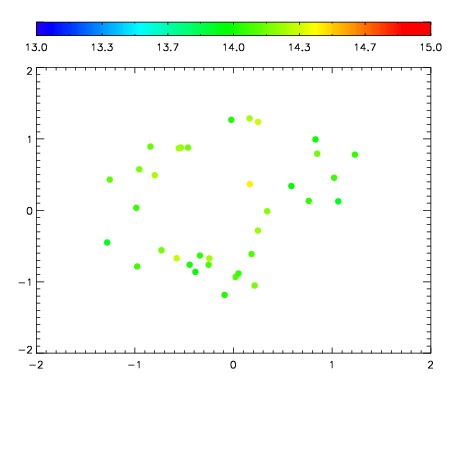
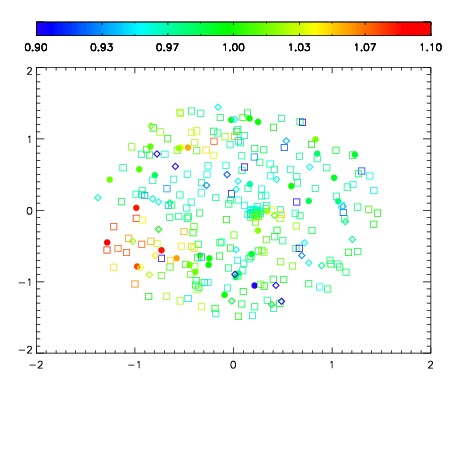
| Spatial sky telluric CO2 absorption deviations (filled: H < 10)
|
| 7890094
| 47
| | Red | Green | Blue
| | z | | 18.95
| | znorm | | 14.77
| | sky | 14.7 | 14.2 | 14.2
| | S/N | 14.1 | 22.2 | 24.2
| | S/N(c) | 31.2 | 16.8 | 7.6
| | SN(E/C) 0.43
|
| 
| 
| 
| 
| 
|
| 7890095
| 47
| | Red | Green | Blue
| | z | | 19.01
| | znorm | | 14.83
| | sky | 14.6 | 14.1 | 14.4
| | S/N | 14.9 | 23.8 | 25.9
| | S/N(c) | 32.5 | 17.4 | 7.9
| | SN(E/C) 0.41
|
| 
| 
| 
| 
| 
|
| 7890096
| 47
| | Red | Green | Blue
| | z | | 19.03
| | znorm | | 14.85
| | sky | 14.8 | 14.3 | 14.3
| | S/N | 15.3 | 24.3 | 26.0
| | S/N(c) | 32.8 | 17.5 | 8.0
| | SN(E/C) 0.40
|
| 
| 
| 
| 
| 
|
| 7890097
| 47
| | Red | Green | Blue
| | z | | 19.03
| | znorm | | 14.85
| | sky | 14.6 | 14.3 | 14.4
| | S/N | 14.9 | 24.2 | 25.9
| | S/N(c) | 32.8 | 17.6 | 8.0
| | SN(E/C) 0.38
|
| 
| 
| 
| 
| 
|
| 7890098
| 47
| | Red | Green | Blue
| | z | | 19.07
| | znorm | | 14.89
| | sky | 14.8 | 14.5 | 14.5
| | S/N | 15.3 | 24.8 | 26.6
| | S/N(c) | 33.6 | 17.8 | 8.1
| | SN(E/C) 0.41
|
| 
| 
| 
| 
| 
|
| 7890099
| 47
| | Red | Green | Blue
| | z | | 19.06
| | znorm | | 14.88
| | sky | 14.9 | 14.5 | 14.5
| | S/N | 15.6 | 24.6 | 26.3
| | S/N(c) | 33.6 | 17.8 | 8.1
| | SN(E/C) 0.40
|
| 
| 
| 
| 
| 
|
| 7890100
| 47
| | Red | Green | Blue
| | z | | 19.05
| | znorm | | 14.87
| | sky | 14.9 | 14.4 | 14.4
| | S/N | 15.3 | 24.5 | 26.3
| | S/N(c) | 33.3 | 17.7 | 8.1
| | SN(E/C) 0.40
|
| 
| 
| 
| 
| 
|
| 7890101
| 47
| | Red | Green | Blue
| | z | | 19.03
| | znorm | | 14.85
| | sky | 15.0 | 14.5 | 14.4
| | S/N | 15.1 | 24.5 | 26.1
| | S/N(c) | 33.0 | 17.5 | 8.0
| | SN(E/C) 0.40
|
| 
| 
| 
| 
| 
|