| Red | Green | Blue | |
| z | 17.64 | ||
| znorm | Inf | ||
| sky | -Inf | -Inf | -Inf |
| S/N | 25.2 | 44.7 | 48.1 |
| S/N(c) | 0.0 | 0.0 | 0.0 |
| SN(E/C) |

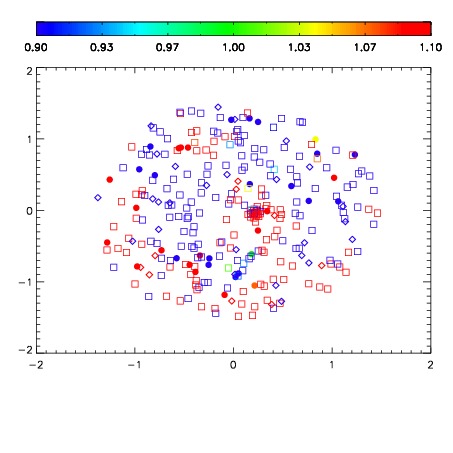


| Frame | Nreads | Zeropoints | Mag plots | Spatial mag deviation | Spatial sky 16325A emission deviations (filled: sky, open: star) | Spatial sky continuum emission | Spatial sky telluric CO2 absorption deviations (filled: H < 10) | |||||||||||||||||||||||
| 0 | 0 |
|
|
|
|
|
|
| IPAIR | NAME | SHIFT | NEWSHIFT | S/N | NAME | SHIFT | NEWSHIFT | S/N |
| 0 | 07890100 | 0.467598 | 0.00000 | 19.0367 | 07890097 | -8.23438e-05 | 0.467680 | 19.0176 |
| 1 | 07890099 | 0.467050 | 0.000548005 | 19.0430 | 07890098 | -0.000442914 | 0.468041 | 19.0511 |
| 2 | 07890096 | 0.467309 | 0.000288993 | 19.0215 | 07890101 | 0.000835628 | 0.466762 | 19.0151 |
| 3 | 07890095 | 0.467044 | 0.000553995 | 19.0018 | 07890094 | 0.00000 | 0.467598 | 18.9470 |