| Red | Green | Blue | |
| z | 17.64 | ||
| znorm | Inf | ||
| sky | -Inf | -Inf | -Inf |
| S/N | 14.5 | 26.5 | 29.2 |
| S/N(c) | 0.0 | 0.0 | 0.0 |
| SN(E/C) |


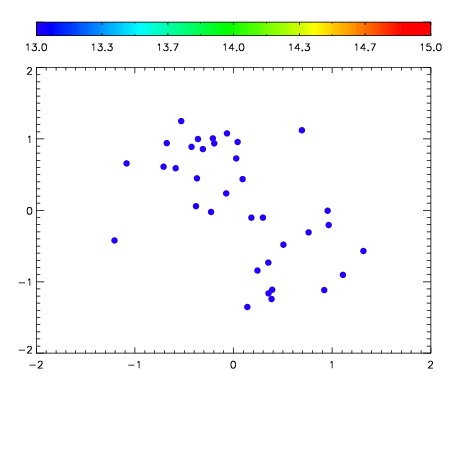

| Frame | Nreads | Zeropoints | Mag plots | Spatial mag deviation | Spatial sky 16325A emission deviations (filled: sky, open: star) | Spatial sky continuum emission | Spatial sky telluric CO2 absorption deviations (filled: H < 10) | |||||||||||||||||||||||
| 0 | 0 |
|
|
|
|
|
|
| IPAIR | NAME | SHIFT | NEWSHIFT | S/N | NAME | SHIFT | NEWSHIFT | S/N |
| 0 | 04920060 | 0.491311 | 0.00000 | 18.6144 | 04920061 | 0.000434586 | 0.490876 | 18.3134 |
| 1 | 04920059 | 0.489431 | 0.00188002 | 18.8530 | 04920058 | 0.00000 | 0.491311 | 19.0463 |
| 2 | 04920063 | 0.488380 | 0.00293100 | 16.8473 | 04920062 | 0.000783865 | 0.490527 | 18.1348 |
| 3 | 04920064 | 0.490544 | 0.000767022 | 15.0875 | 04920065 | -0.000903226 | 0.492214 | 16.4444 |