| Red | Green | Blue | |
| z | 17.64 | ||
| znorm | Inf | ||
| sky | -Inf | -NaN | -Inf |
| S/N | 29.9 | 50.4 | 54.7 |
| S/N(c) | 0.0 | 0.0 | 0.0 |
| SN(E/C) |


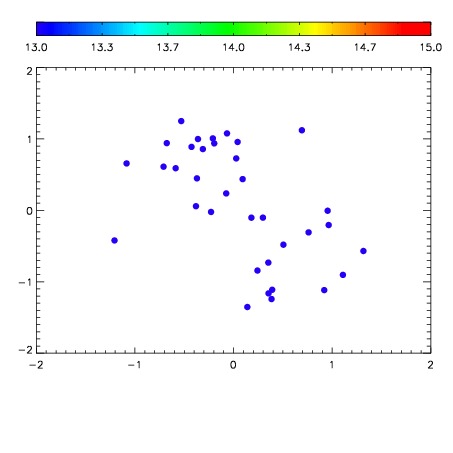

| Frame | Nreads | Zeropoints | Mag plots | Spatial mag deviation | Spatial sky 16325A emission deviations (filled: sky, open: star) | Spatial sky continuum emission | Spatial sky telluric CO2 absorption deviations (filled: H < 10) | |||||||||||||||||||||||
| 0 | 0 |
|
|
|
|
|
|
| IPAIR | NAME | SHIFT | NEWSHIFT | S/N | NAME | SHIFT | NEWSHIFT | S/N |
| 0 | 05220030 | 0.495157 | 0.00000 | 19.1426 | 05220029 | 0.00116653 | 0.493990 | 19.1537 |
| 1 | 05220031 | 0.495141 | 1.60038e-05 | 19.1671 | 05220032 | 0.00444341 | 0.490714 | 19.1648 |
| 2 | 05220026 | 0.494782 | 0.000375003 | 19.1175 | 05220028 | 0.00194945 | 0.493208 | 19.1435 |
| 3 | 05220027 | 0.494466 | 0.000690997 | 19.1039 | 05220025 | 0.00000 | 0.495157 | 19.0805 |