| Red | Green | Blue | |
| z | 17.64 | ||
| znorm | Inf | ||
| sky | -Inf | -Inf | -Inf |
| S/N | 30.4 | 48.4 | 51.9 |
| S/N(c) | 0.0 | 0.0 | 0.0 |
| SN(E/C) |

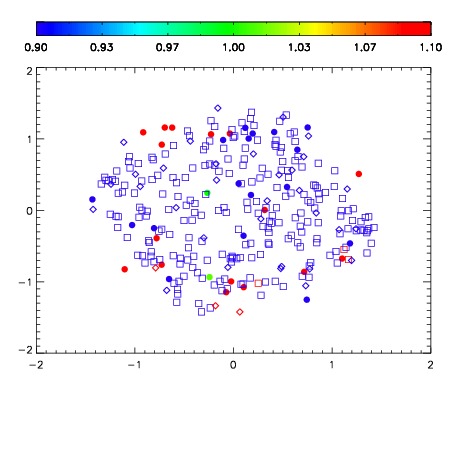
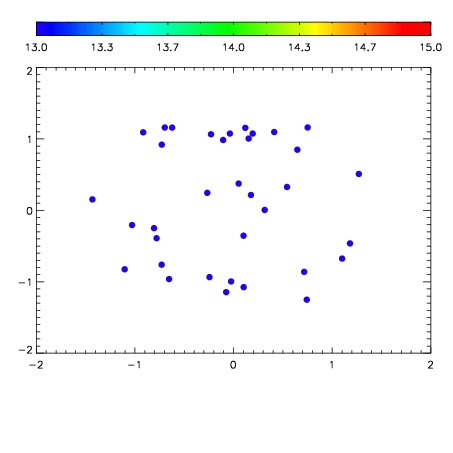

| Frame | Nreads | Zeropoints | Mag plots | Spatial mag deviation | Spatial sky 16325A emission deviations (filled: sky, open: star) | Spatial sky continuum emission | Spatial sky telluric CO2 absorption deviations (filled: H < 10) | |||||||||||||||||||||||
| 0 | 0 |
|
|
|
|
|
|
| IPAIR | NAME | SHIFT | NEWSHIFT | S/N | NAME | SHIFT | NEWSHIFT | S/N |
| 0 | 04650064 | 0.483486 | 0.00000 | 18.5744 | 04650065 | -0.000486213 | 0.483972 | 18.7629 |
| 1 | 04650059 | 0.462273 | 0.0212130 | 19.1306 | 04650058 | 0.00000 | 0.483486 | 19.1467 |
| 2 | 04650060 | 0.467300 | 0.0161860 | 19.0064 | 04650062 | -0.00266995 | 0.486156 | 19.0081 |
| 3 | 04650063 | 0.473921 | 0.00956500 | 18.8938 | 04650061 | -0.00103608 | 0.484522 | 18.9280 |