| Red | Green | Blue | |
| z | 17.64 | ||
| znorm | Inf | ||
| sky | -Inf | -Inf | -NaN |
| S/N | 21.9 | 37.5 | 37.6 |
| S/N(c) | 0.0 | 0.0 | 0.0 |
| SN(E/C) |
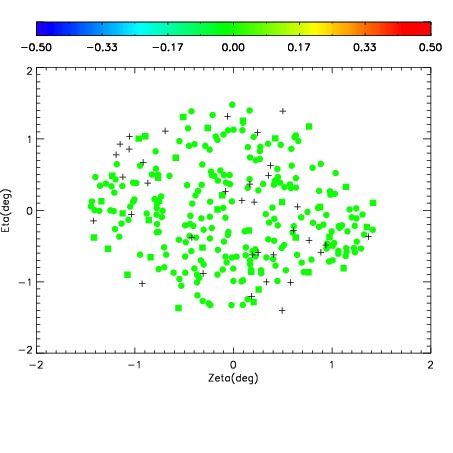
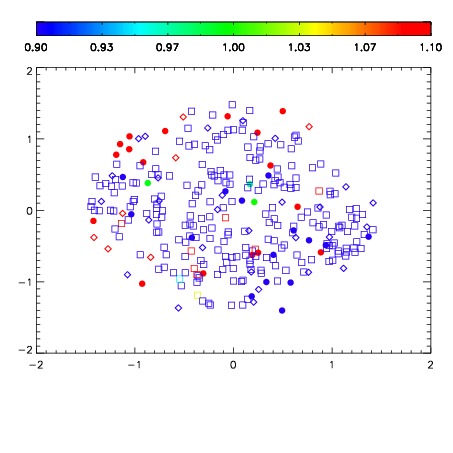
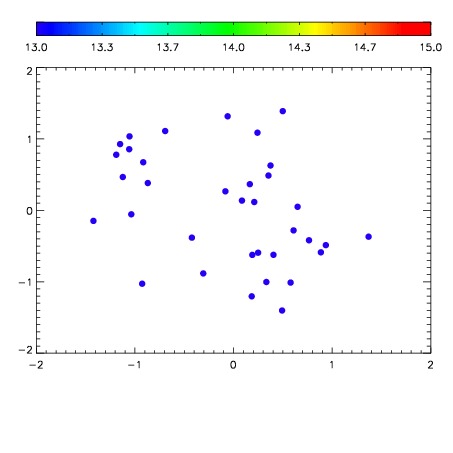

| Frame | Nreads | Zeropoints | Mag plots | Spatial mag deviation | Spatial sky 16325A emission deviations (filled: sky, open: star) | Spatial sky continuum emission | Spatial sky telluric CO2 absorption deviations (filled: H < 10) | |||||||||||||||||||||||
| 0 | 0 |
|
|
|
|
|
|
| IPAIR | NAME | SHIFT | NEWSHIFT | S/N | NAME | SHIFT | NEWSHIFT | S/N |
| 0 | 04630040 | 0.495506 | 0.00000 | 18.8624 | 04630041 | 0.00225832 | 0.493248 | 18.8810 |
| 1 | 04630035 | 0.487073 | 0.00843298 | 18.9578 | 04630034 | 0.00000 | 0.495506 | 18.9247 |
| 2 | 04630036 | 0.487337 | 0.00816900 | 18.9569 | 04630037 | 0.00257131 | 0.492935 | 18.8892 |
| 3 | 04630039 | 0.488784 | 0.00672200 | 18.8534 | 04630038 | 0.00178230 | 0.493724 | 18.7887 |