| Red | Green | Blue | |
| z | 17.64 | ||
| znorm | Inf | ||
| sky | -Inf | -Inf | -Inf |
| S/N | 26.4 | 43.3 | 44.1 |
| S/N(c) | 0.0 | 0.0 | 0.0 |
| SN(E/C) |
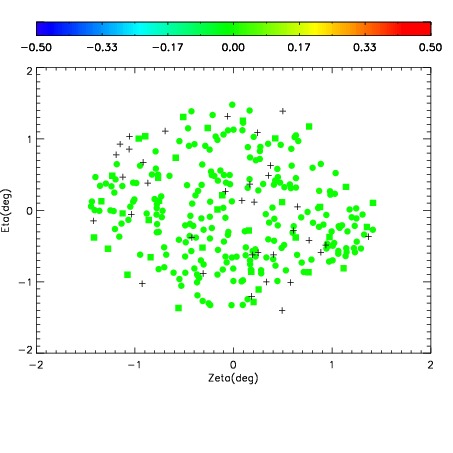

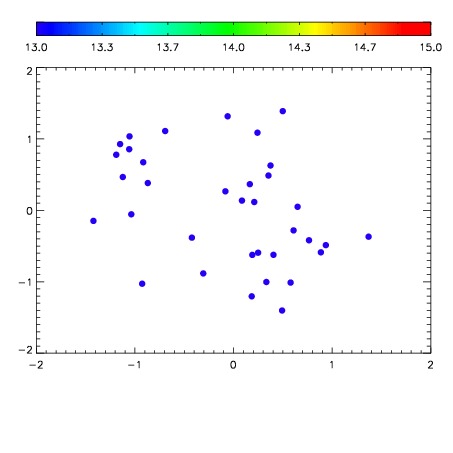

| Frame | Nreads | Zeropoints | Mag plots | Spatial mag deviation | Spatial sky 16325A emission deviations (filled: sky, open: star) | Spatial sky continuum emission | Spatial sky telluric CO2 absorption deviations (filled: H < 10) | |||||||||||||||||||||||
| 0 | 0 |
|
|
|
|
|
|
| IPAIR | NAME | SHIFT | NEWSHIFT | S/N | NAME | SHIFT | NEWSHIFT | S/N |
| 0 | 04890075 | 0.481388 | 0.00000 | 19.0072 | 04890073 | 0.00000 | 0.481388 | 18.9861 |
| 1 | 04890079 | 0.479362 | 0.00202599 | 19.1646 | 04890080 | 0.00137728 | 0.480011 | 19.1047 |
| 2 | 04890074 | 0.477705 | 0.00368300 | 19.1264 | 04890077 | 0.000411953 | 0.480976 | 19.0744 |
| 3 | 04890078 | 0.479730 | 0.00165799 | 19.0931 | 04890076 | 0.00244175 | 0.478946 | 19.0540 |