| Red | Green | Blue | |
| z | 17.64 | ||
| znorm | Inf | ||
| sky | -Inf | -Inf | -Inf |
| S/N | 25.5 | 42.8 | 45.6 |
| S/N(c) | 0.0 | 0.0 | 0.0 |
| SN(E/C) |
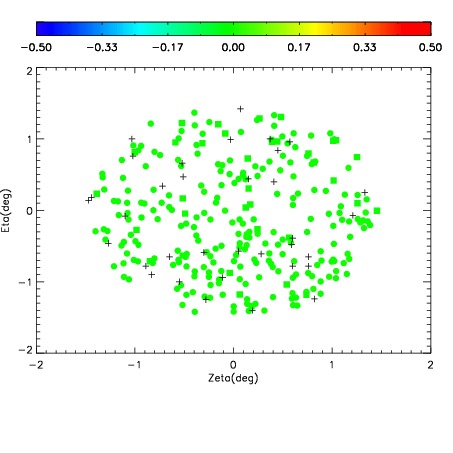
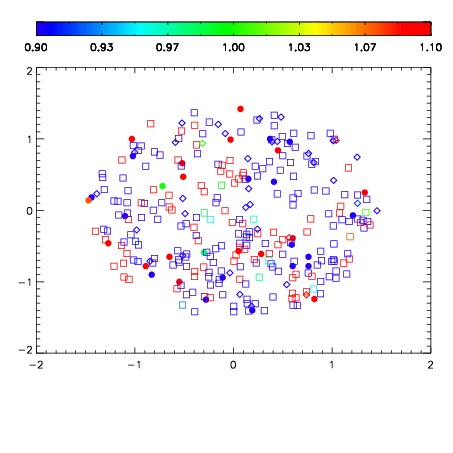
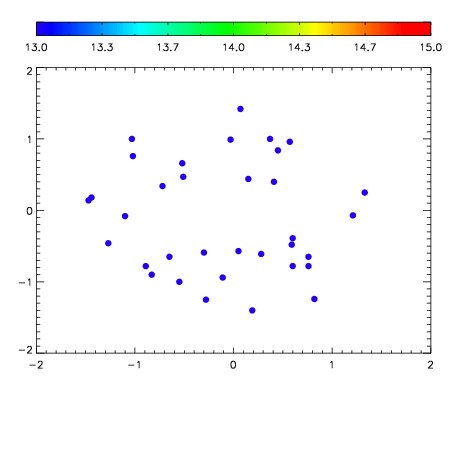

| Frame | Nreads | Zeropoints | Mag plots | Spatial mag deviation | Spatial sky 16325A emission deviations (filled: sky, open: star) | Spatial sky continuum emission | Spatial sky telluric CO2 absorption deviations (filled: H < 10) | |||||||||||||||||||||||
| 0 | 0 |
|
|
|
|
|
|
| IPAIR | NAME | SHIFT | NEWSHIFT | S/N | NAME | SHIFT | NEWSHIFT | S/N |
| 0 | 05180038 | 0.493745 | 0.00000 | 18.9975 | 05180040 | 0.00166457 | 0.492080 | 19.0168 |
| 1 | 05180039 | 0.493220 | 0.000524998 | 19.0304 | 05180036 | 0.00127252 | 0.492472 | 19.0428 |
| 2 | 05180035 | 0.493098 | 0.000647008 | 19.0170 | 05180037 | -0.000540887 | 0.494286 | 19.0291 |
| 3 | 05180034 | 0.493688 | 5.70118e-05 | 18.9844 | 05180033 | 0.00000 | 0.493745 | 18.9420 |