| Red | Green | Blue | |
| z | 17.64 | ||
| znorm | Inf | ||
| sky | -NaN | -Inf | -NaN |
| S/N | 22.6 | 38.4 | 41.6 |
| S/N(c) | 0.0 | 0.0 | 0.0 |
| SN(E/C) |
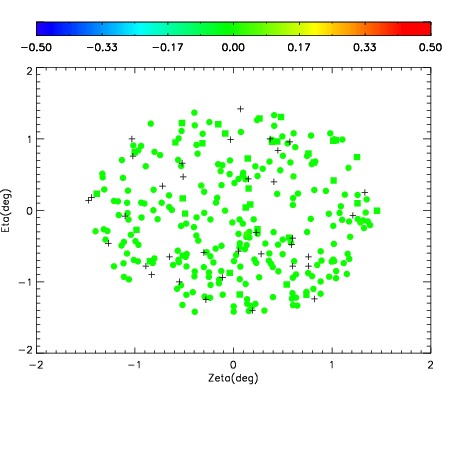

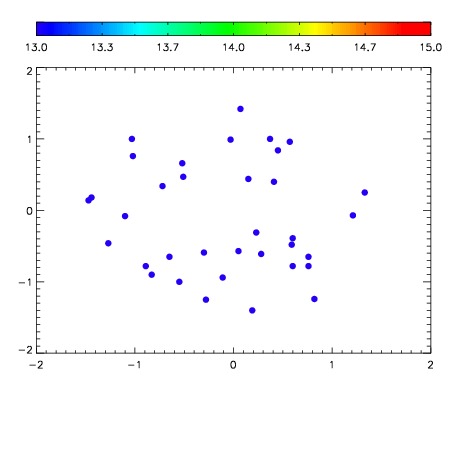

| Frame | Nreads | Zeropoints | Mag plots | Spatial mag deviation | Spatial sky 16325A emission deviations (filled: sky, open: star) | Spatial sky continuum emission | Spatial sky telluric CO2 absorption deviations (filled: H < 10) | |||||||||||||||||||||||
| 0 | 0 |
|
|
|
|
|
|
| IPAIR | NAME | SHIFT | NEWSHIFT | S/N | NAME | SHIFT | NEWSHIFT | S/N |
| 0 | 08730035 | 0.479942 | 0.00000 | 18.9401 | 08730033 | 0.00000 | 0.479942 | 19.0066 |
| 1 | 08730034 | 0.478777 | 0.00116500 | 18.9081 | 08730037 | -0.000848224 | 0.480790 | 18.9730 |
| 2 | 08730038 | 0.479333 | 0.000608981 | 18.8347 | 08730036 | -0.000547658 | 0.480490 | 18.9499 |
| 3 | 08730039 | 0.479739 | 0.000202984 | 18.8296 | 08730040 | -0.000102045 | 0.480044 | 18.8486 |