| Red | Green | Blue | |
| z | 17.64 | ||
| znorm | Inf | ||
| sky | -Inf | -Inf | -Inf |
| S/N | 25.7 | 42.2 | 46.2 |
| S/N(c) | 0.0 | 0.0 | 0.0 |
| SN(E/C) |
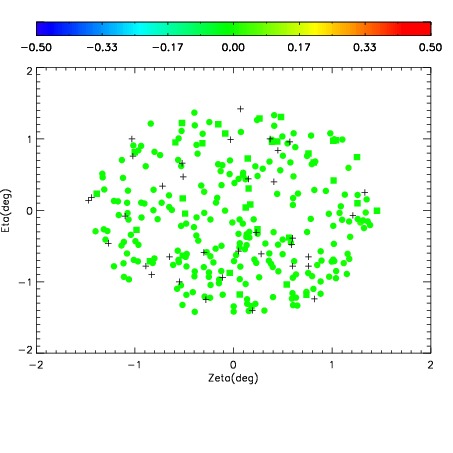
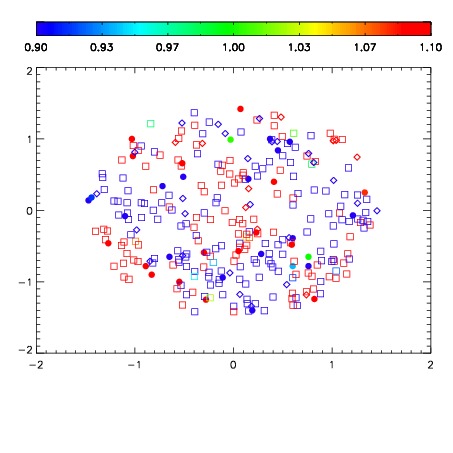
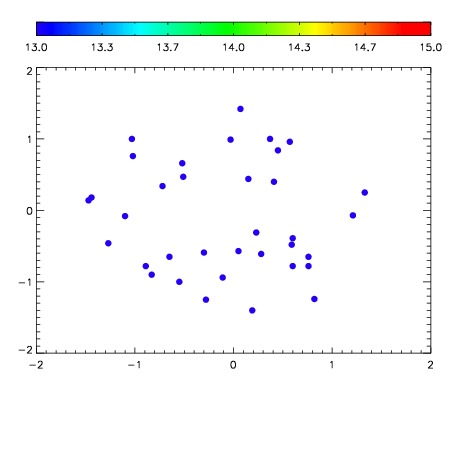

| Frame | Nreads | Zeropoints | Mag plots | Spatial mag deviation | Spatial sky 16325A emission deviations (filled: sky, open: star) | Spatial sky continuum emission | Spatial sky telluric CO2 absorption deviations (filled: H < 10) | |||||||||||||||||||||||
| 0 | 0 |
|
|
|
|
|
|
| IPAIR | NAME | SHIFT | NEWSHIFT | S/N | NAME | SHIFT | NEWSHIFT | S/N |
| 0 | 09050013 | 0.478650 | 0.00000 | 18.9725 | 09050014 | -0.000254298 | 0.478904 | 18.9852 |
| 1 | 09050017 | 0.478299 | 0.000351012 | 18.9166 | 09050015 | -0.000372075 | 0.479022 | 18.9518 |
| 2 | 09050016 | 0.477464 | 0.00118601 | 18.9146 | 09050018 | 0.000208964 | 0.478441 | 18.9398 |
| 3 | 09050012 | 0.477906 | 0.000744015 | 18.8890 | 09050011 | 0.00000 | 0.478650 | 18.9390 |