| Red | Green | Blue | |
| z | 17.64 | ||
| znorm | Inf | ||
| sky | -NaN | -Inf | -Inf |
| S/N | 25.9 | 44.9 | 47.8 |
| S/N(c) | 0.0 | 0.0 | 0.0 |
| SN(E/C) |
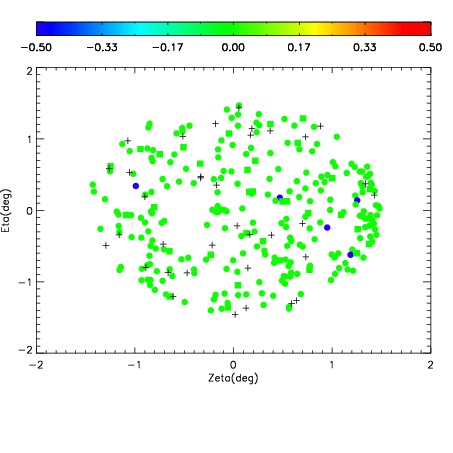
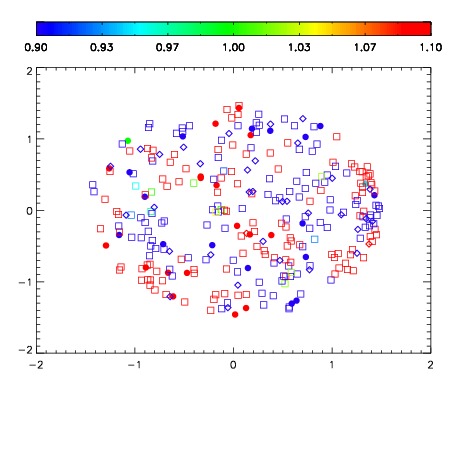
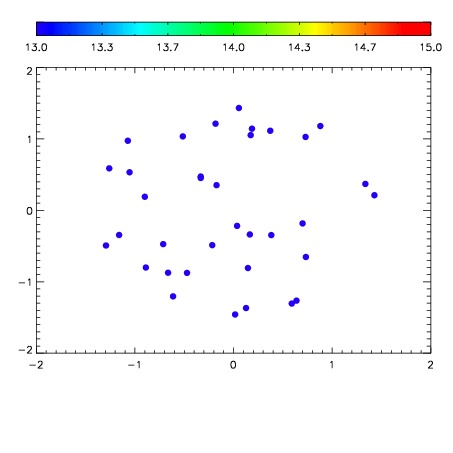

| Frame | Nreads | Zeropoints | Mag plots | Spatial mag deviation | Spatial sky 16325A emission deviations (filled: sky, open: star) | Spatial sky continuum emission | Spatial sky telluric CO2 absorption deviations (filled: H < 10) | |||||||||||||||||||||||
| 0 | 0 |
|
|
|
|
|
|
| IPAIR | NAME | SHIFT | NEWSHIFT | S/N | NAME | SHIFT | NEWSHIFT | S/N |
| 0 | 04900060 | 0.485802 | 0.00000 | 19.0914 | 04900062 | -0.00143667 | 0.487239 | 19.0873 |
| 1 | 04900059 | 0.485537 | 0.000265002 | 19.0623 | 04900061 | -0.000732144 | 0.486534 | 19.0826 |
| 2 | 04900064 | 0.485638 | 0.000164002 | 18.8738 | 04900065 | -0.00204865 | 0.487851 | 19.0448 |
| 3 | 04900063 | 0.485217 | 0.000584990 | 18.7268 | 04900058 | 0.00000 | 0.485802 | 19.0369 |