| Red | Green | Blue | |
| z | 17.64 | ||
| znorm | Inf | ||
| sky | -NaN | -NaN | -Inf |
| S/N | 26.3 | 45.8 | 47.9 |
| S/N(c) | 0.0 | 0.0 | 0.0 |
| SN(E/C) |
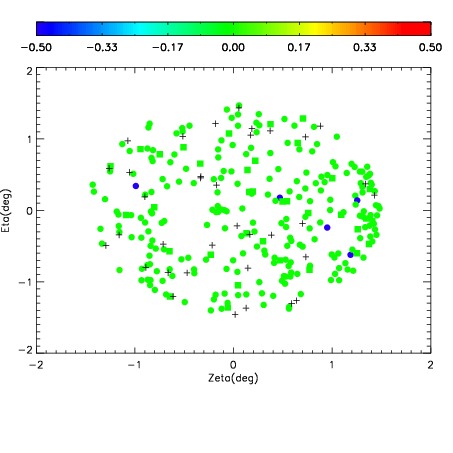

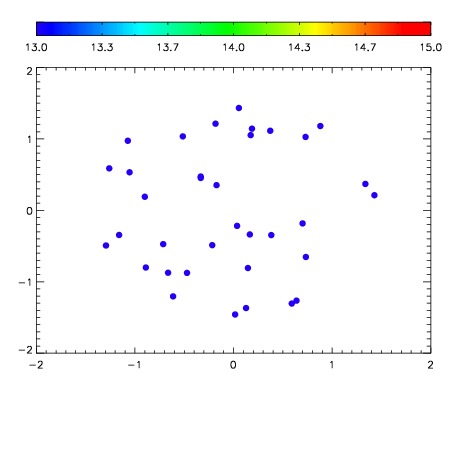

| Frame | Nreads | Zeropoints | Mag plots | Spatial mag deviation | Spatial sky 16325A emission deviations (filled: sky, open: star) | Spatial sky continuum emission | Spatial sky telluric CO2 absorption deviations (filled: H < 10) | |||||||||||||||||||||||
| 0 | 0 |
|
|
|
|
|
|
| IPAIR | NAME | SHIFT | NEWSHIFT | S/N | NAME | SHIFT | NEWSHIFT | S/N |
| 0 | 05200042 | 0.492996 | 0.00000 | 18.9143 | 05200043 | -0.00101884 | 0.494015 | 18.9851 |
| 1 | 05200038 | 0.489091 | 0.00390500 | 18.9966 | 05200040 | -0.00518882 | 0.498185 | 19.0219 |
| 2 | 05200041 | 0.490119 | 0.00287700 | 18.9910 | 05200039 | -0.00271502 | 0.495711 | 18.9904 |
| 3 | 05200037 | 0.489397 | 0.00359902 | 18.8823 | 05200036 | 0.00000 | 0.492996 | 18.9736 |