| Red | Green | Blue | |
| z | 17.63 | ||
| znorm | Inf | ||
| sky | -Inf | -NaN | -Inf |
| S/N | 16.6 | 30.8 | 31.9 |
| S/N(c) | 0.0 | 0.0 | 0.0 |
| SN(E/C) |
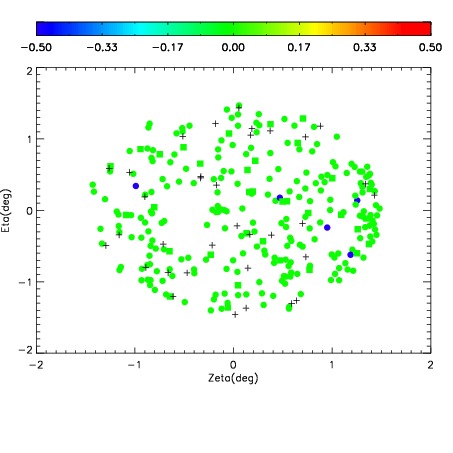
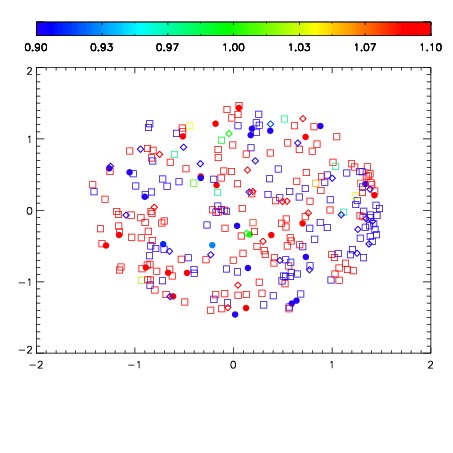


| Frame | Nreads | Zeropoints | Mag plots | Spatial mag deviation | Spatial sky 16325A emission deviations (filled: sky, open: star) | Spatial sky continuum emission | Spatial sky telluric CO2 absorption deviations (filled: H < 10) | |||||||||||||||||||||||
| 0 | 0 |
|
|
|
|
|
|
| IPAIR | NAME | SHIFT | NEWSHIFT | S/N | NAME | SHIFT | NEWSHIFT | S/N |
| 0 | 05470025 | 0.492719 | 0.00000 | 18.0802 | 05470026 | 0.00209743 | 0.490622 | 17.7360 |
| 1 | 05470024 | 0.490863 | 0.00185600 | 18.4478 | 05470023 | 0.00000 | 0.492719 | 18.5452 |
| 2 | 05470029 | 0.489543 | 0.00317600 | 18.4459 | 05470030 | 0.000956063 | 0.491763 | 18.3832 |
| 3 | 05470028 | 0.490257 | 0.00246200 | 18.4301 | 05470027 | 0.000226330 | 0.492493 | 18.2845 |