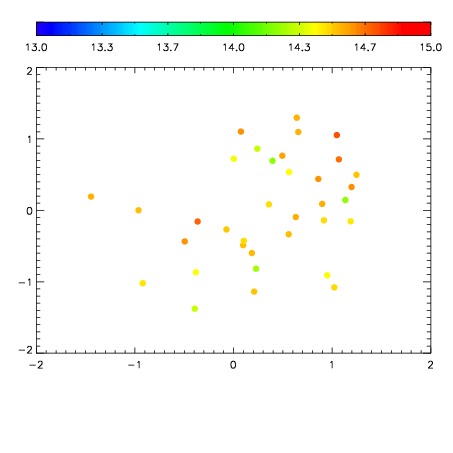
| Frame | Nreads | Zeropoints | Mag plots
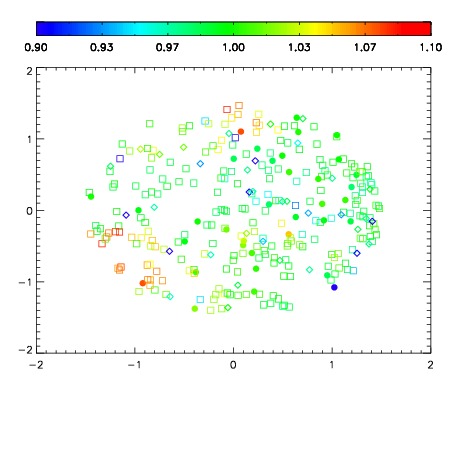
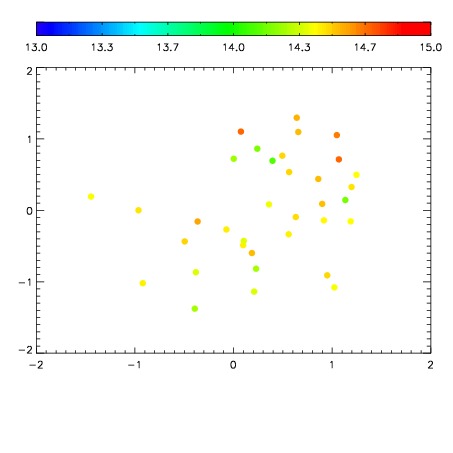
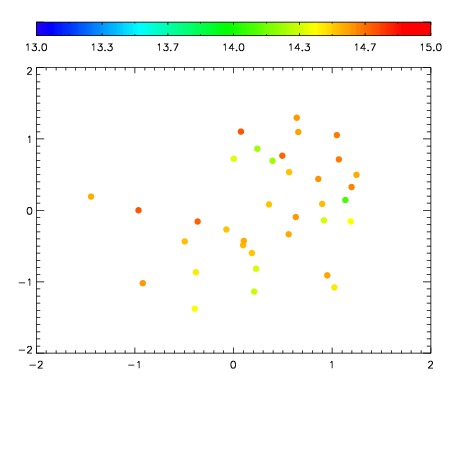
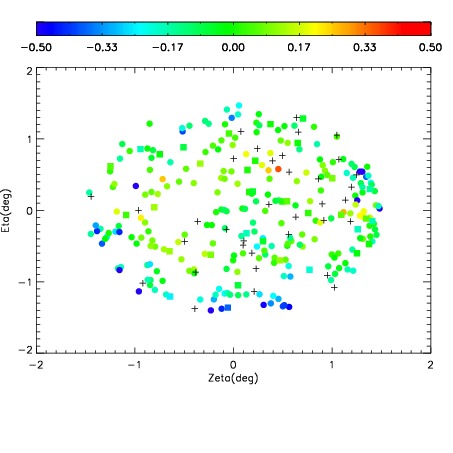
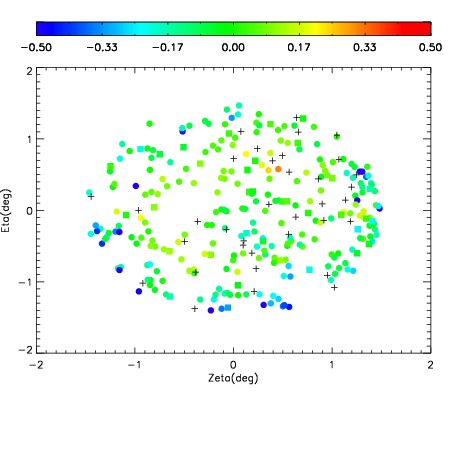
| Spatial mag deviation
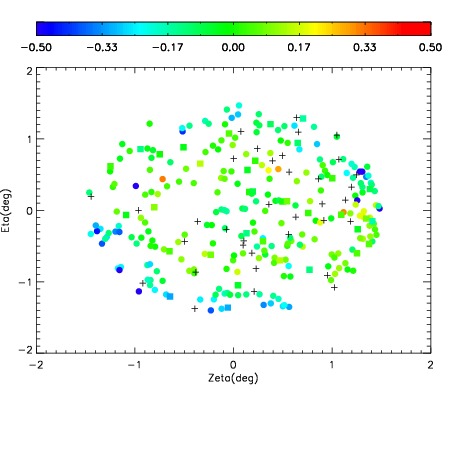
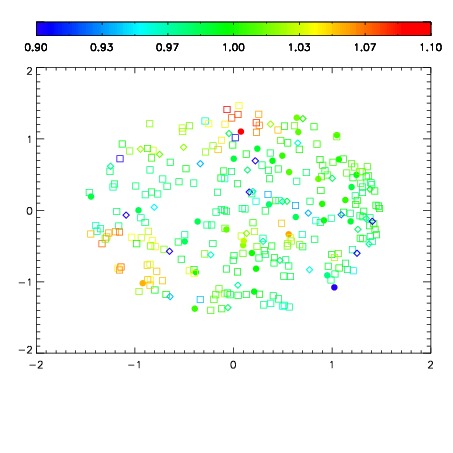
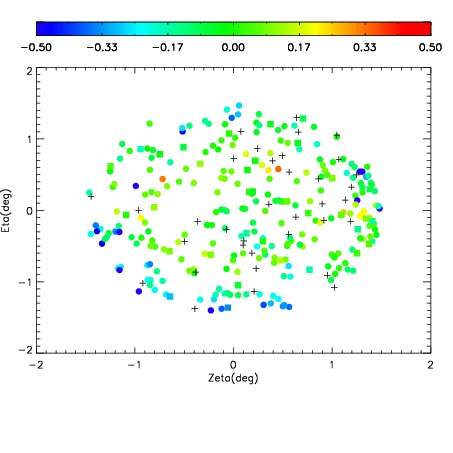
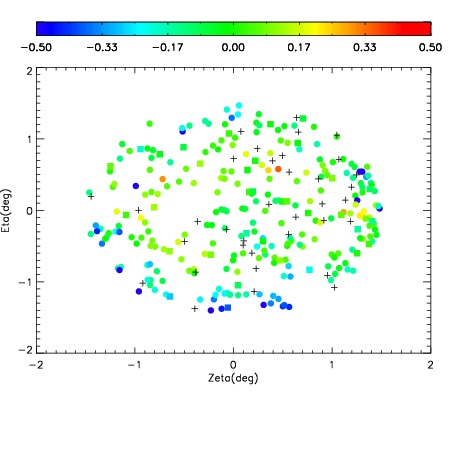
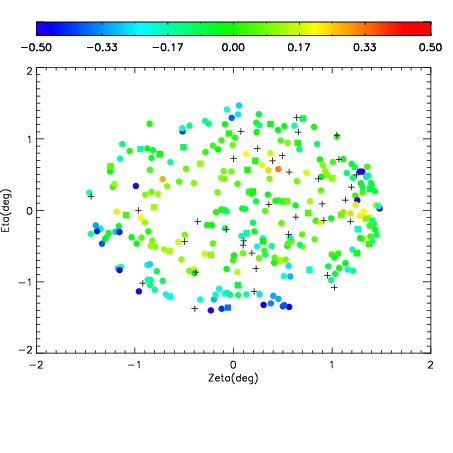
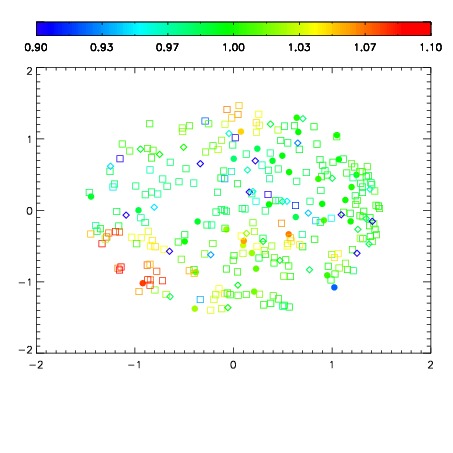
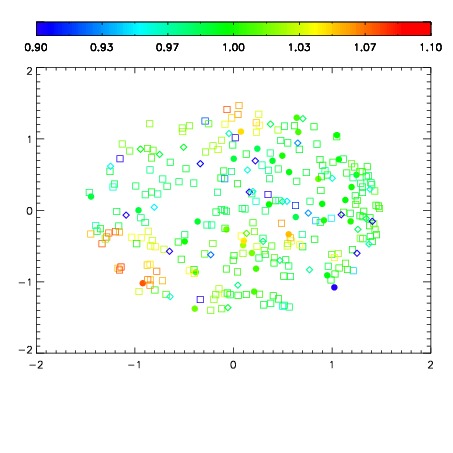
| Spatial sky 16325A emission deviations (filled: sky, open: star)
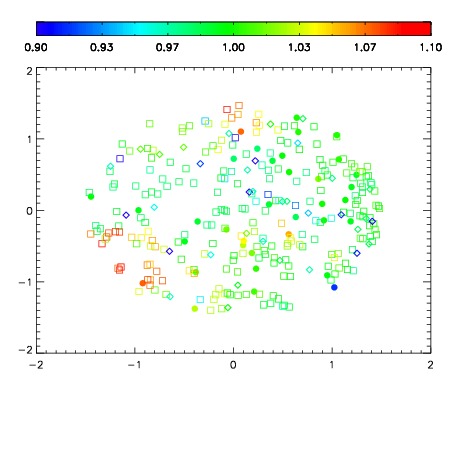
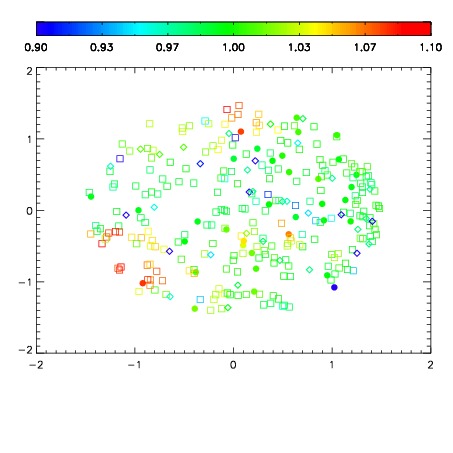
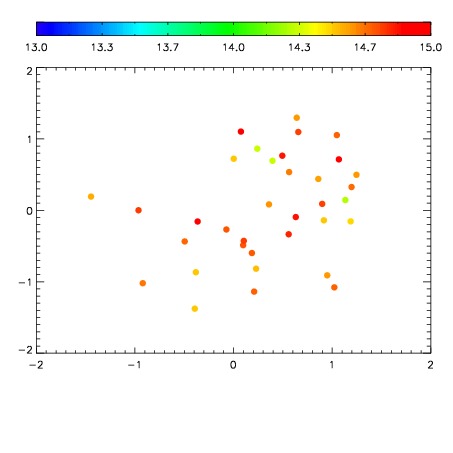
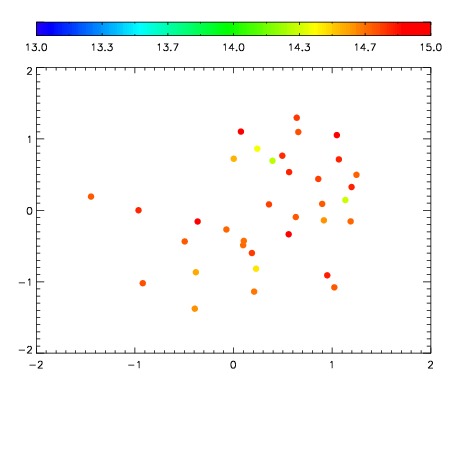
| Spatial sky continuum emission
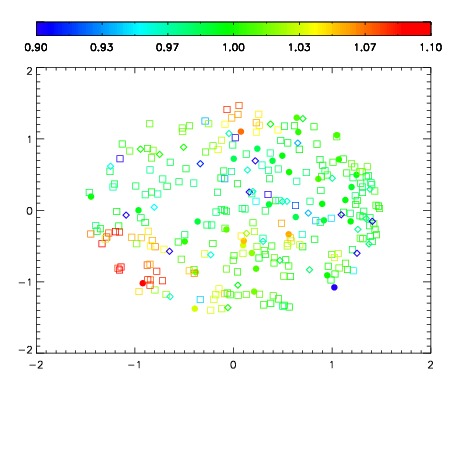
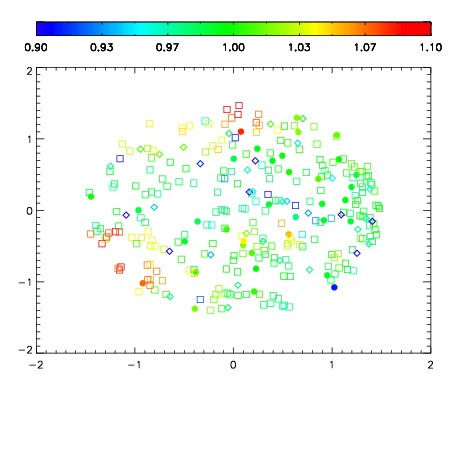
| Spatial sky telluric CO2 absorption deviations (filled: H < 10)
|
| 4910058
| 47
| | Red | Green | Blue
| | z | | 18.86
| | znorm | | 14.68
| | sky | 14.8 | 14.4 | 14.3
| | S/N | 13.6 | 22.8 | 23.4
| | S/N(c) | 16.8 | 16.1 | 31.8
| | SN(E/C) 0.60
|
| 
| 
| 
| 
| 
|
| 4910059
| 47
| | Red | Green | Blue
| | z | | 18.73
| | znorm | | 14.55
| | sky | 14.7 | 14.4 | 14.6
| | S/N | 12.7 | 21.8 | 22.8
| | S/N(c) | 16.0 | 15.4 | 29.3
| | SN(E/C) 0.62
|
| 
| 
| 
| 
| 
|
| 4910060
| 47
| | Red | Green | Blue
| | z | | 18.96
| | znorm | | 14.78
| | sky | 14.5 | 14.5 | 14.5
| | S/N | 14.8 | 25.0 | 26.1
| | S/N(c) | 17.9 | 17.0 | 32.8
| | SN(E/C) 0.57
|
| 
| 
| 
| 
| 
|
| 4910061
| 47
| | Red | Green | Blue
| | z | | 19.06
| | znorm | | 14.88
| | sky | 14.5 | 14.4 | 14.6
| | S/N | 15.8 | 26.1 | 27.9
| | S/N(c) | 19.0 | 17.6 | 34.1
| | SN(E/C) 0.52
|
| 
| 
| 
| 
| 
|
| 4910062
| 47
| | Red | Green | Blue
| | z | | 19.07
| | znorm | | 14.89
| | sky | 14.6 | 14.5 | 14.7
| | S/N | 15.6 | 26.4 | 28.2
| | S/N(c) | 18.9 | 17.5 | 33.8
| | SN(E/C) 0.54
|
| 
| 
| 
| 
| 
|
| 4910063
| 47
| | Red | Green | Blue
| | z | | 19.05
| | znorm | | 14.87
| | sky | 14.8 | 14.6 | 14.7
| | S/N | 15.6 | 26.3 | 28.0
| | S/N(c) | 18.6 | 17.5 | 34.0
| | SN(E/C) 0.56
|
| 
| 
| 
| 
| 
|
| 4910064
| 47
| | Red | Green | Blue
| | z | | 19.06
| | znorm | | 14.88
| | sky | 14.6 | 14.7 | 14.7
| | S/N | 15.5 | 26.3 | 28.4
| | S/N(c) | 18.9 | 17.7 | 34.2
| | SN(E/C) 0.53
|
| 
| 
| 
| 
| 
|
| 4910065
| 47
| | Red | Green | Blue
| | z | | 19.08
| | znorm | | 14.90
| | sky | 14.8 | 14.7 | 14.8
| | S/N | 15.9 | 26.9 | 29.0
| | S/N(c) | 18.5 | 17.4 | 34.3
| | SN(E/C) 0.55
|
| 
| 
| 
| 
| 
|