| Red | Green | Blue | |
| z | 17.63 | ||
| znorm | Inf | ||
| sky | -NaN | -NaN | -Inf |
| S/N | 26.5 | 46.8 | 50.7 |
| S/N(c) | 0.0 | 0.0 | 0.0 |
| SN(E/C) |


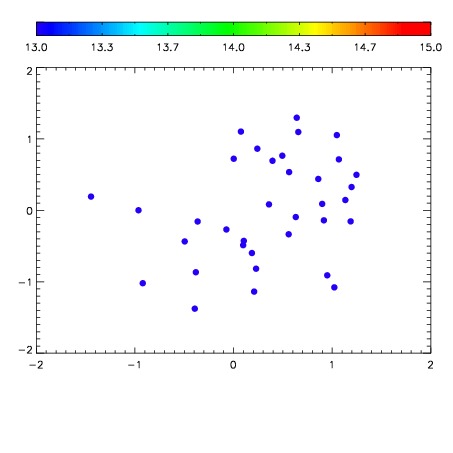

| Frame | Nreads | Zeropoints | Mag plots | Spatial mag deviation | Spatial sky 16325A emission deviations (filled: sky, open: star) | Spatial sky continuum emission | Spatial sky telluric CO2 absorption deviations (filled: H < 10) | |||||||||||||||||||||||
| 0 | 0 |
|
|
|
|
|
|
| IPAIR | NAME | SHIFT | NEWSHIFT | S/N | NAME | SHIFT | NEWSHIFT | S/N |
| 0 | 04910064 | 0.489454 | 0.00000 | 19.0393 | 04910065 | 0.00371699 | 0.485737 | 19.0513 |
| 1 | 04910063 | 0.488300 | 0.00115401 | 19.0364 | 04910062 | 0.000559272 | 0.488895 | 19.0482 |
| 2 | 04910060 | 0.489315 | 0.000138998 | 18.9384 | 04910061 | 0.00298431 | 0.486470 | 19.0365 |
| 3 | 04910059 | 0.487156 | 0.00229800 | 18.7201 | 04910058 | 0.00000 | 0.489454 | 18.8330 |